As awareness of the impact of air quality on health grows, more people are turning to air quality monitors to protect themselves and their families. Whether you’re looking to review a device, assess the performance of your current monitor, or considering a new purchase, understanding how well your air quality monitor works is crucial. With the increasing popularity of these devices, it’s not surprising that they’re receiving more attention from both large and small media outlets, blogs, and influencers. This growing interest is a positive step in the fight against air pollution and its harmful health effects.
However, this surge in attention isn’t without its challenges. At AirGradient, we regularly analyse reviews and user feedback - not just for our own monitors but for those across the market. What we’ve noticed is a recurring issue: a lack of in-depth testing when it comes to evaluating air quality monitors. All too often, reviews and assessments focus on superficial aspects like the number of sensors or the screen size without truly delving into the accuracy and performance of the device. While these features are important, they don’t mean much if the sensors aren’t delivering reliable data.
This problem isn’t limited to reviewers - anyone trying to understand how well their monitor works might struggle to find useful information. Testing for accuracy requires specialised, expensive equipment, which most people, including reviewers, don’t have access to. This can lead to unintentional misinformation and a skewed perception of a monitor’s capabilities.
Recognising this gap, we want to help reviewers and anyone interested in air quality monitoring understand and test their devices better. While achieving perfect accuracy would require reference-grade equipment, there are still practical and accessible ways to gauge how well a monitor performs. These methods offer a solid foundation for anyone—whether you’re writing a review, evaluating your monitor, or simply curious - to build on and ensure that the device you rely on provides the best possible information. Let’s get started!
First Steps
Before diving into doing any accuracy testing, here is a short checklist to learn more about the monitor in question and its sensor performance. Read on for more details about each particular.
- Find the sensor brand and model
- Check sensor performance
- Check for sensor/monitor certifications
- Check sensor guidelines and monitor enclosure
- Check a company’s qualitative metrics (science team size, university collaborations, etc.)
Find the Sensor Brand and Model
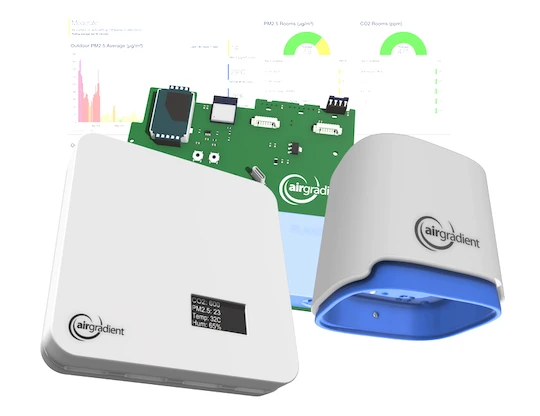
It’s important to note that air quality monitors incorporate pre-built sensors from other third-party companies in most situations. For example, our own AirGradient ONE indoor air quality monitor uses the following sensors:
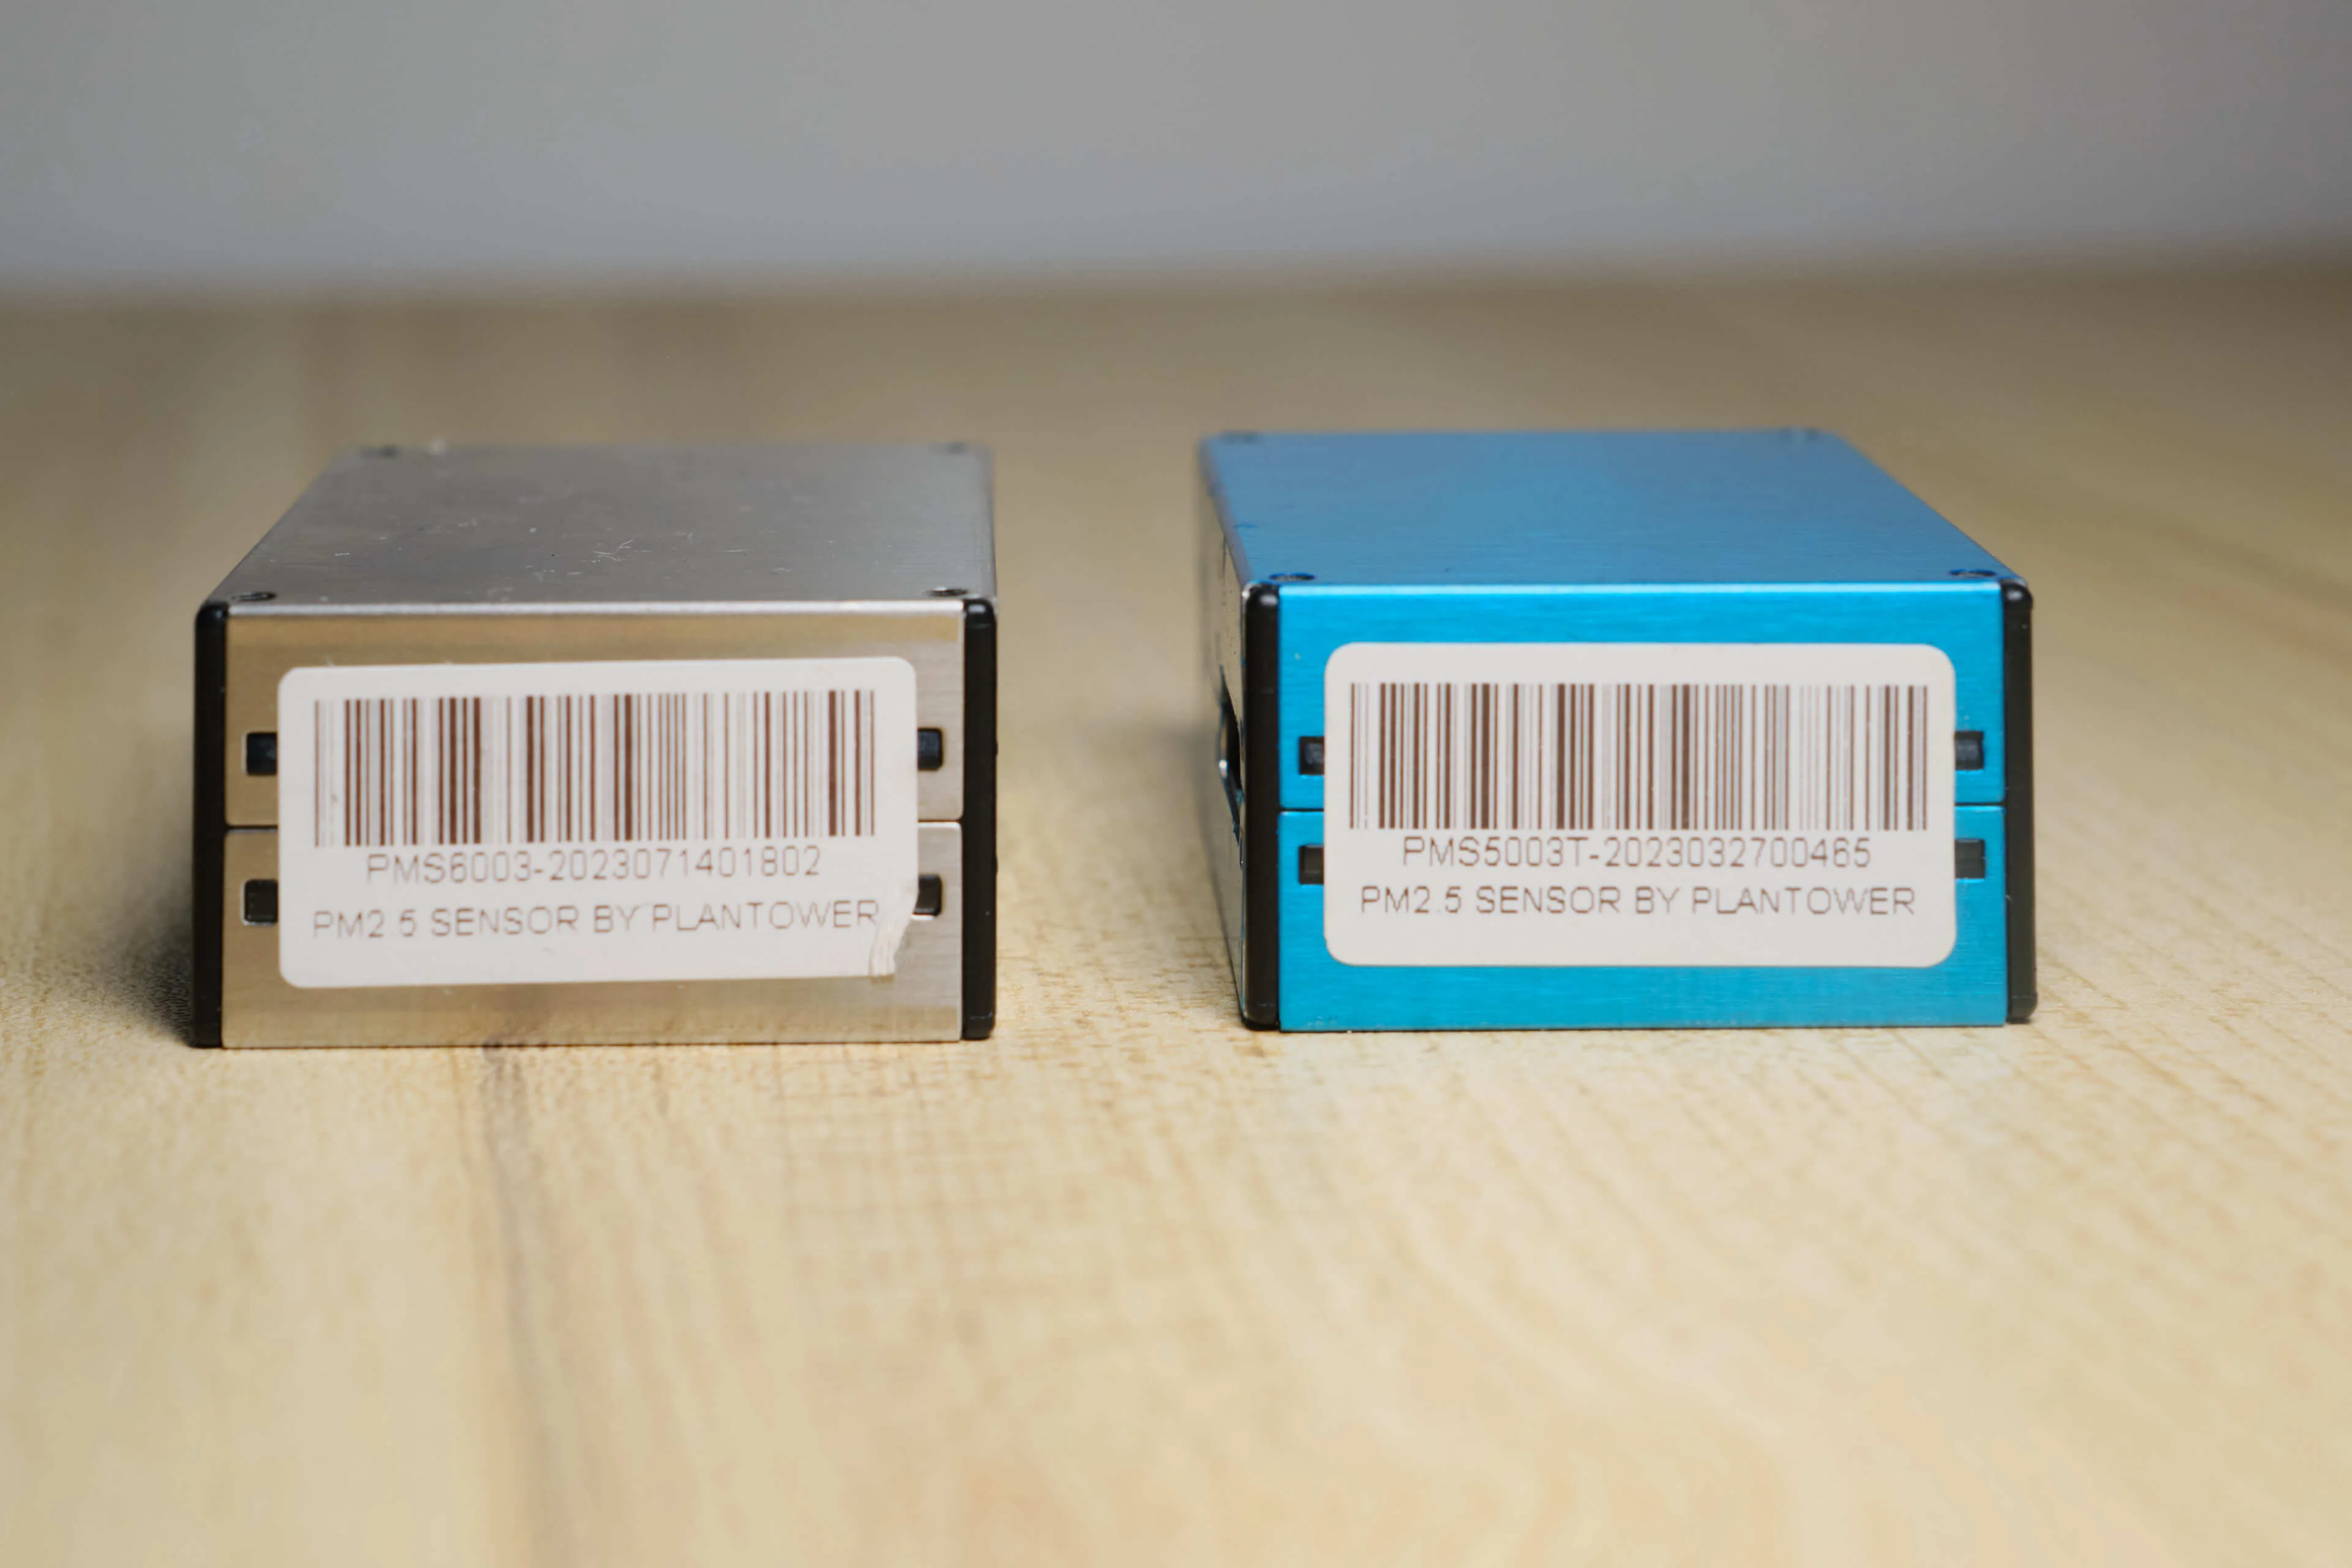
PM sensor - Plantower PMS5003
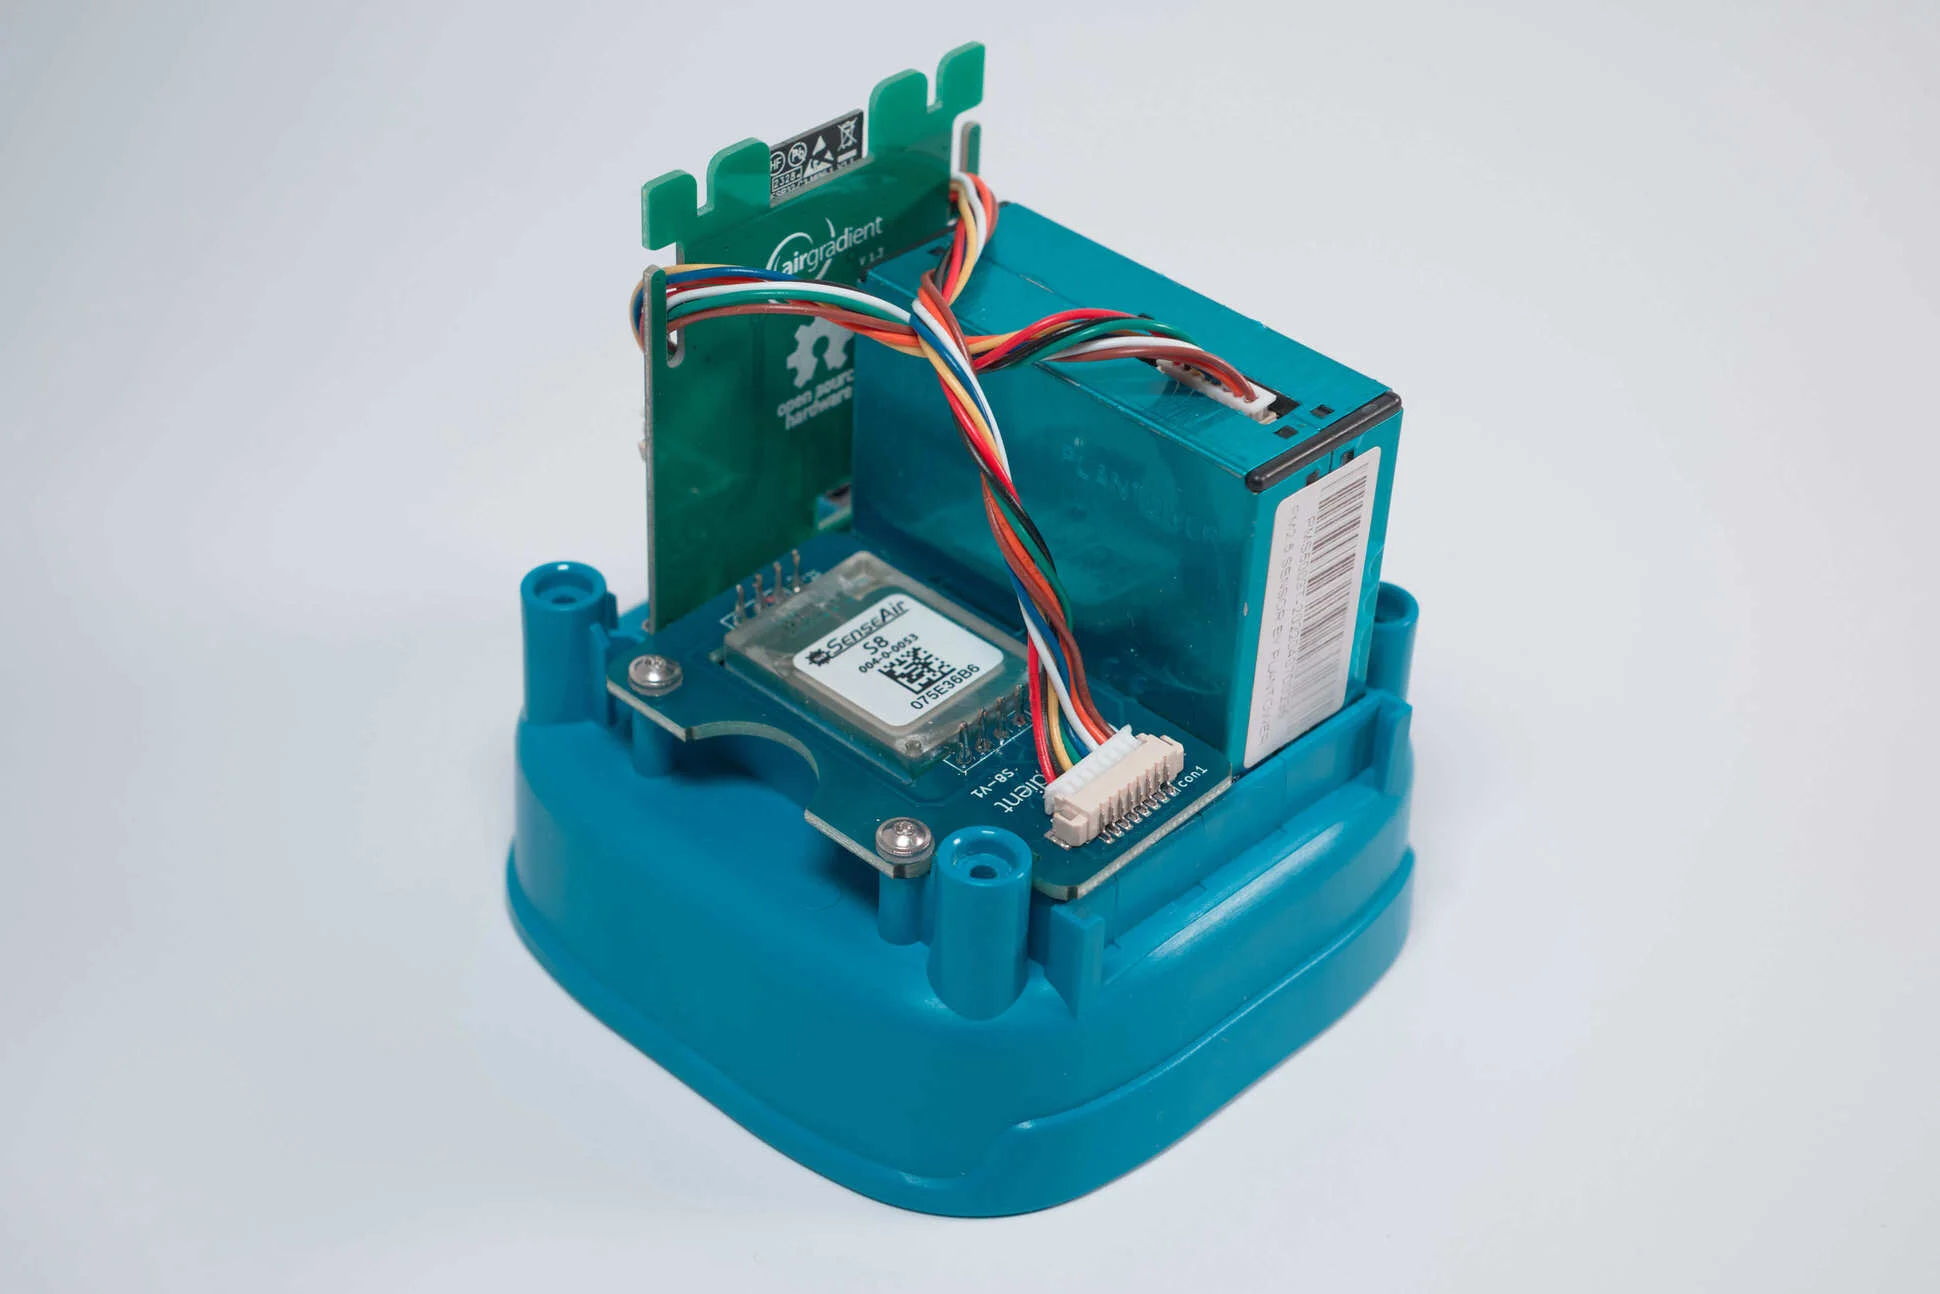
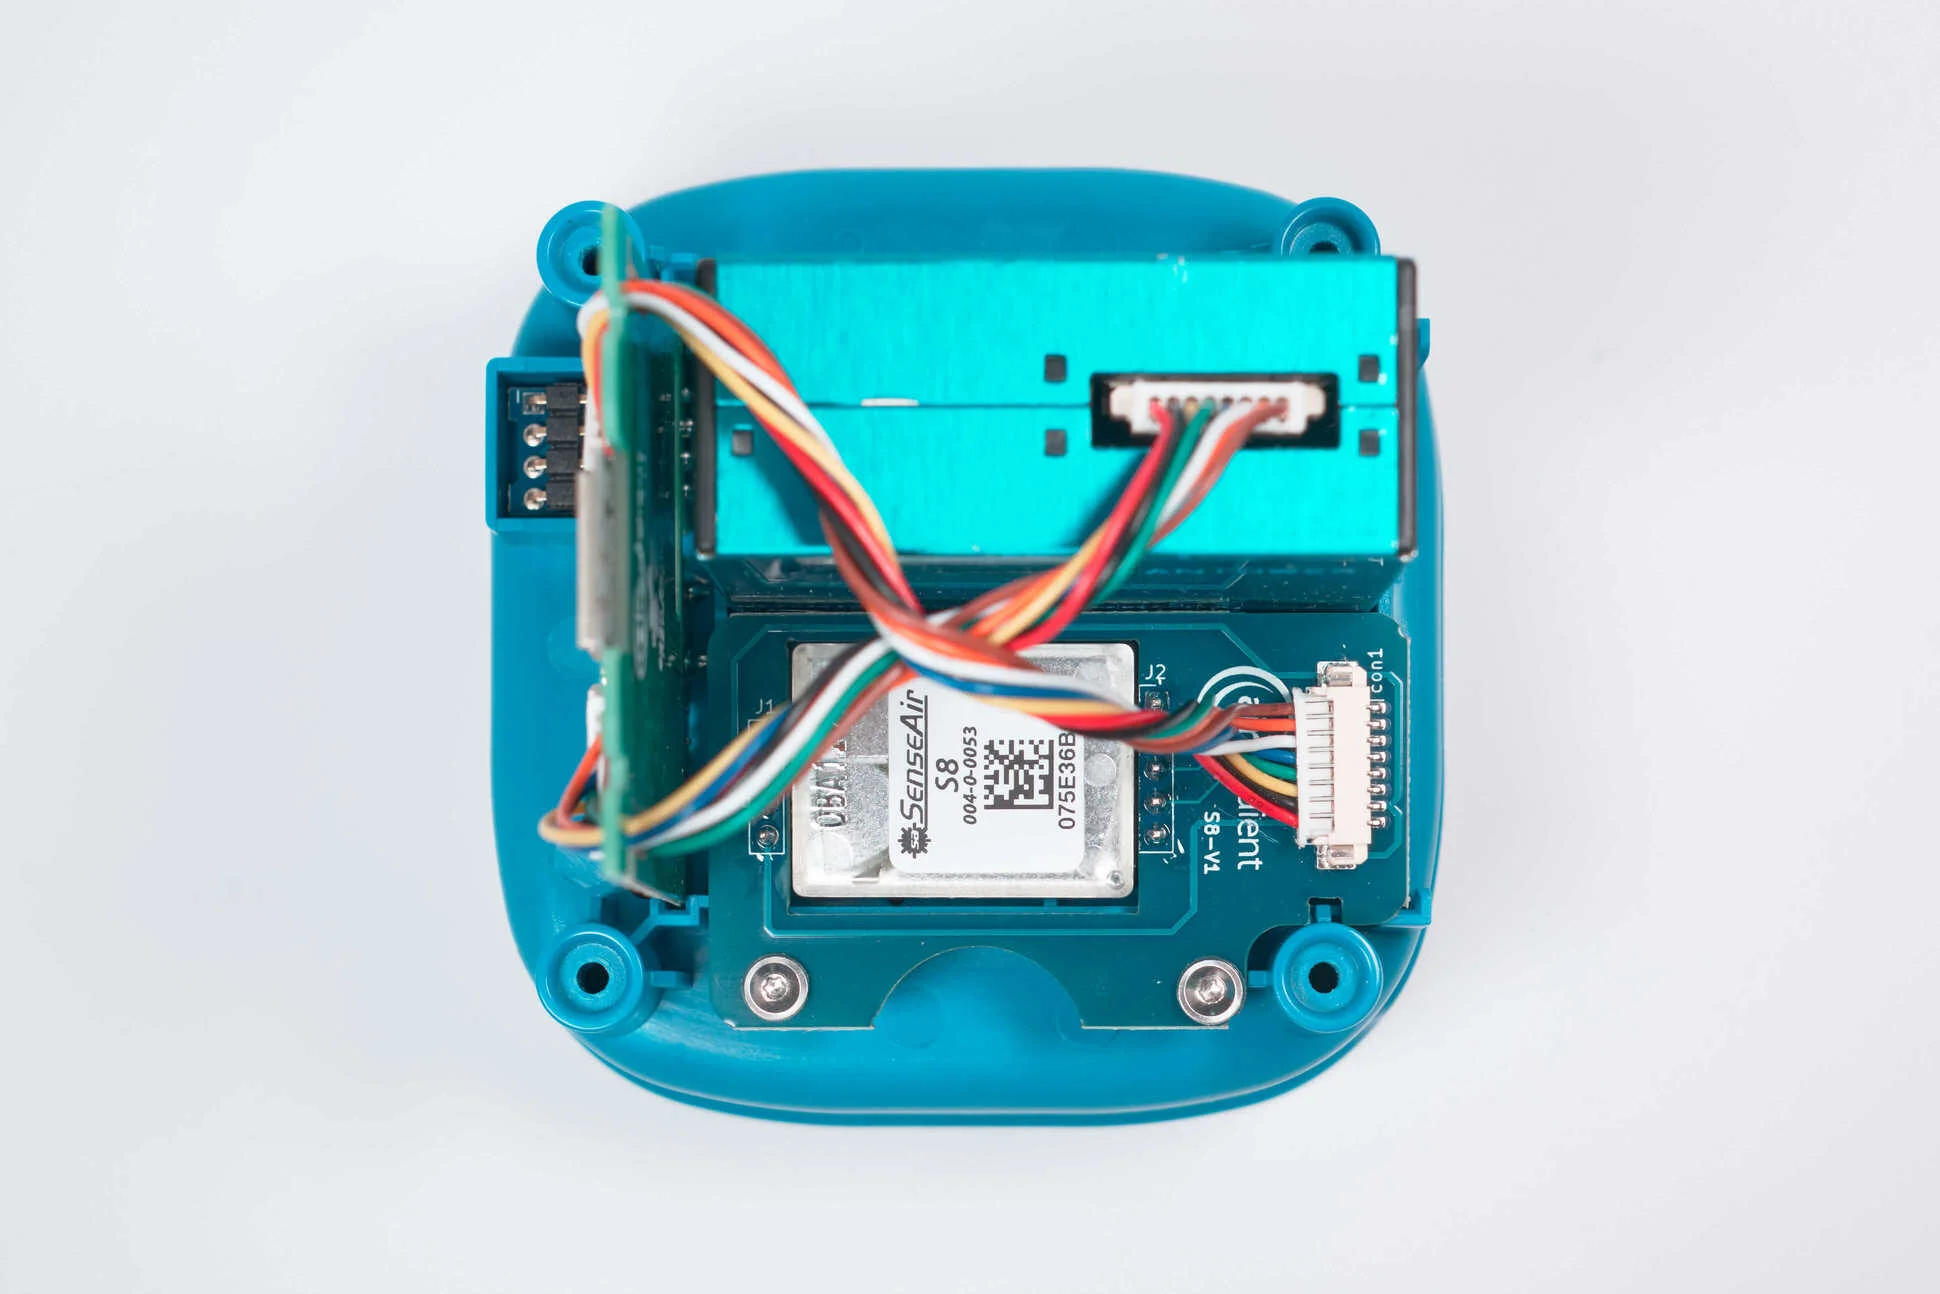
CO2 sensor - Senseair S8
TVOC and NOx: Sensirion SGP41
Temperature and humidity: Sensirion SHT40
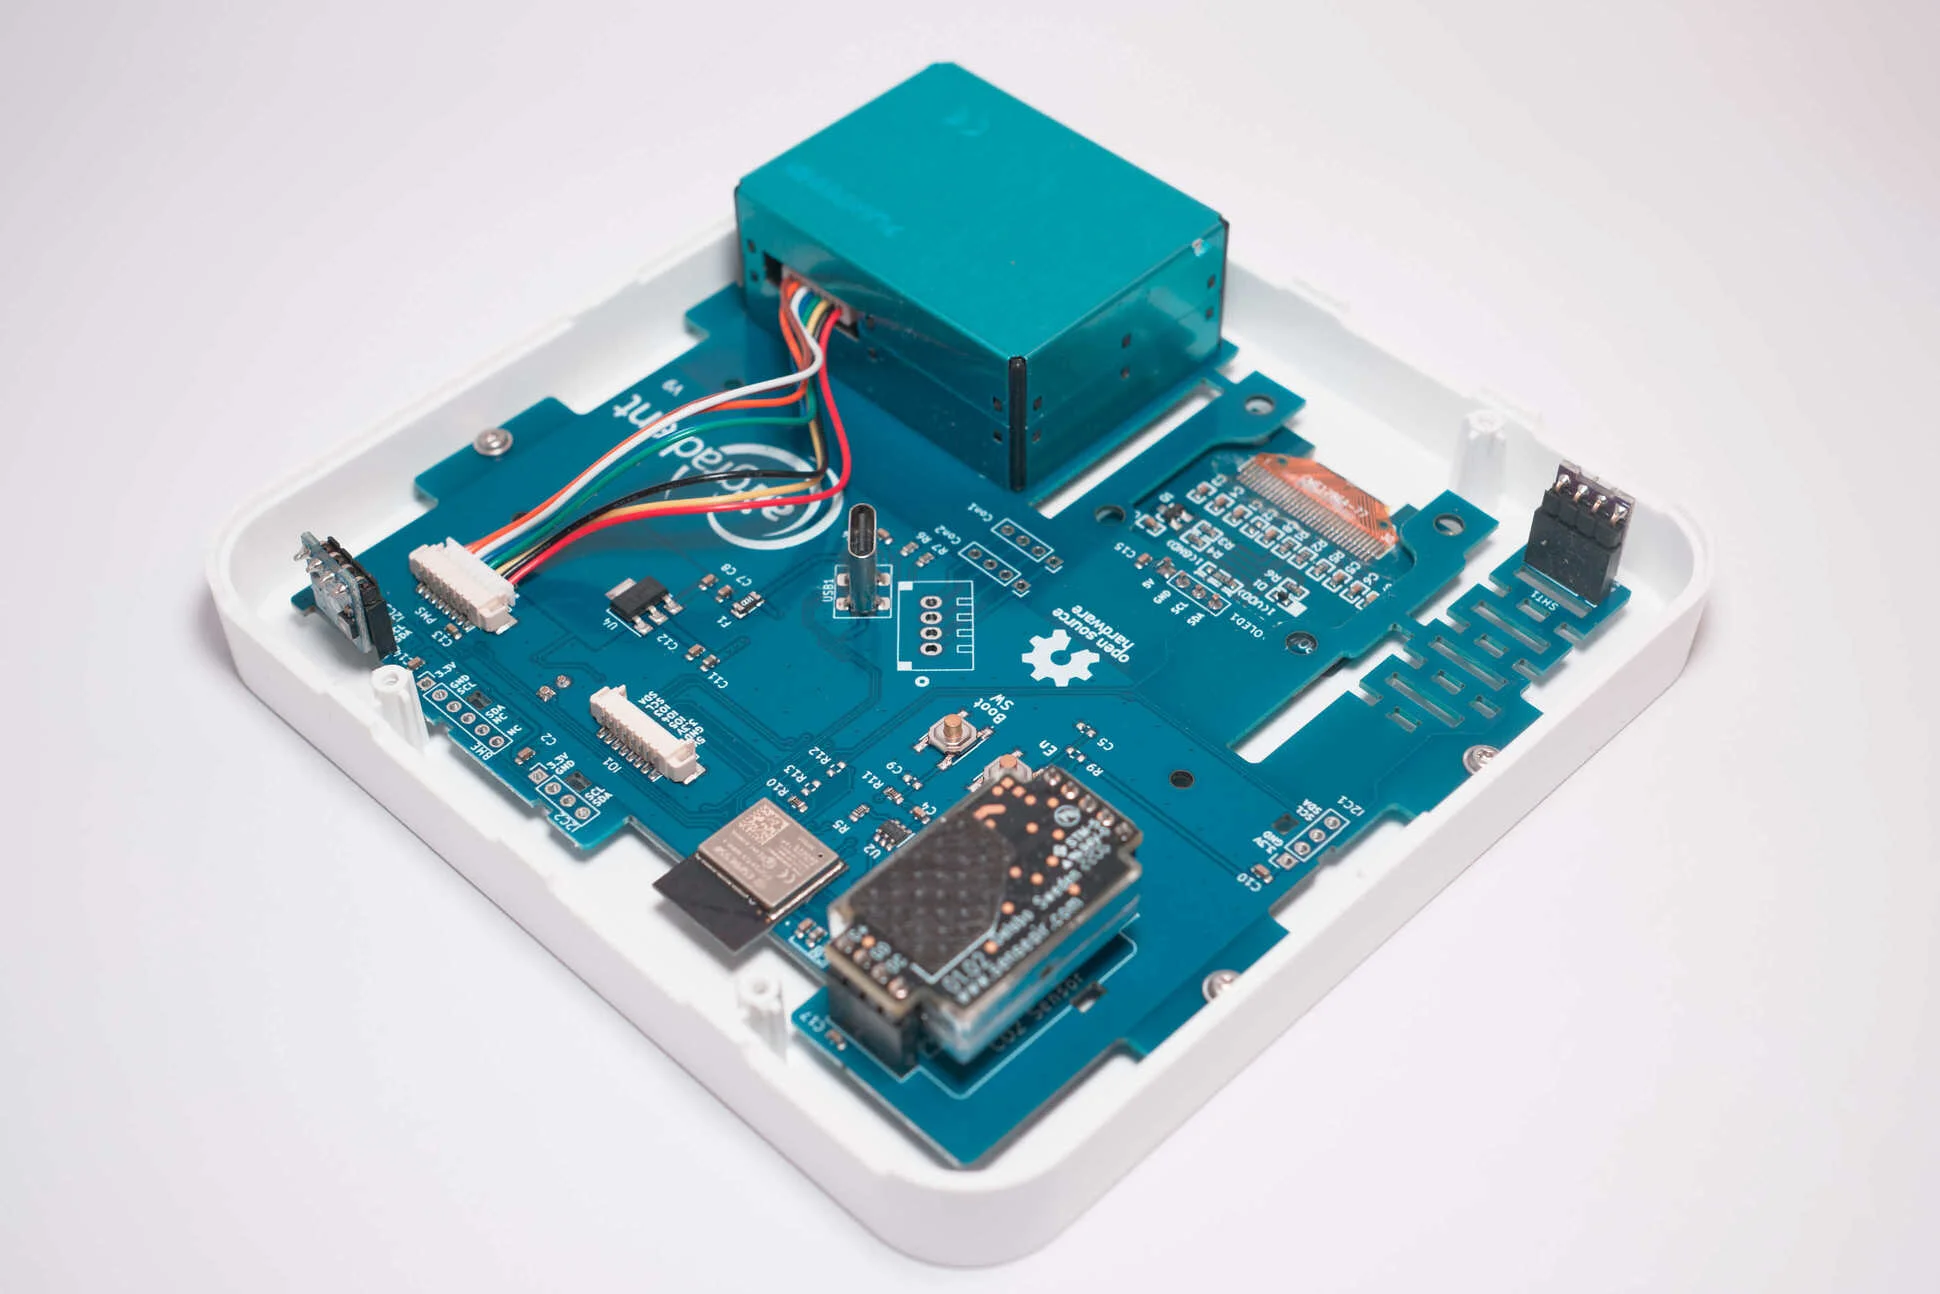
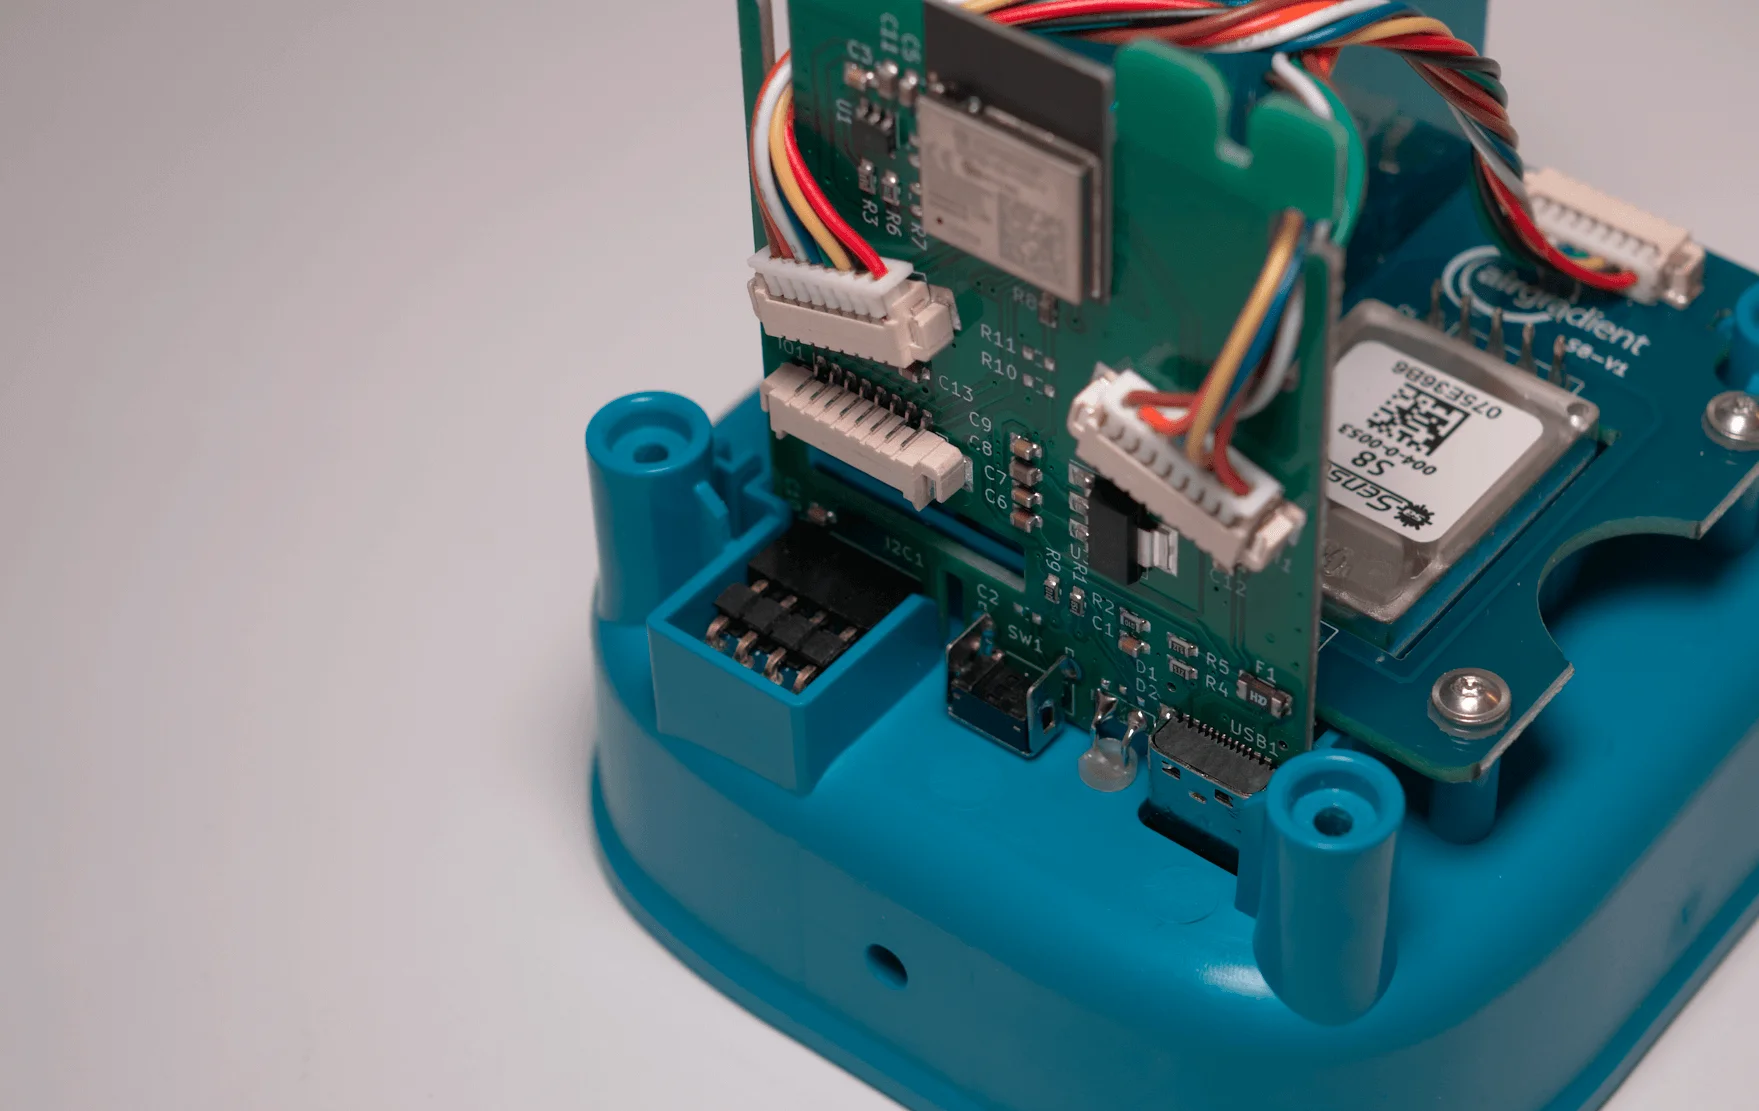
So, how do you find out which sensors a monitor uses? There are three ways. Firstly, you can contact the air quality monitor manufacturer; in most cases, the brand will readily answer the question. If a brand does not provide the sensors’ models, you can research the monitor online or dismantle the monitor yourself, as these components will be labelled. If you don’t want to put your monitor at risk, you can also check the brand’s name on the FCC database, which will return internal photos of the device.
It’s worth noting that many air quality monitor manufacturers use the same components, and, for example, you can find CO2 sensors from Senseair in everything from the AirGradient ONE to the Aranet4 Home. However, while the sensors may be the same, monitor manufacturers can employ different calibrations, which result in different readings. Additionally, the monitor’s enclosure and internal design can impact the sensor modules’ performance.
Check Sensor Performance
It’s important to know which sensors the monitor you are reviewing uses as a simple Google search for the term ‘sensor X accuracy’ often returns studies discussing performance against reference-grade equipment. These studies are a great way to get some background information on the sensors and are a great basis for any review.
In addition to looking at literature and studies on the sensor in question, you can also look at the sensor specifications, such as the manufacturer’s stated accuracy and error. AirGradient monitors use sensors from Plantower, Senseair, and Sensirion, so you might visit these manufacturer websites and compare them to other similarly-priced options.
If searching for the sensor returns some overwhelming-looking studies, I’ve found that AI tools like ChatGPT can do a great job of summarising studies and making them more digestible. Just visit your favourite tool, give it the text and ask it to summarise the study’s key findings. However, keep in mind that AI tools also make mistakes, so always verify key findings.
The South Coast Air Quality Management District (AQMD) and AIRLAB are two third-party organisations that do accuracy testing for some aspects of air quality monitors. These organisations can compare monitors to reference-grade equipment and provide public test reports on their respective websites.
Check for Certifications
Some air quality monitors and the sensors they use are certified by different bodies. One example is RESET Air, which certifies air quality monitors and some sensors used within air quality monitors. Certified monitors must also have a test report, giving you insight into how the monitor performs. The prebuilt AirGradient ONE is one of these devices, and every monitor includes a test report that shows the performance of the sensors and proves they perform to a high standard.
Check Installation Guidelines
Although more of a qualitative metric, a good way to get an overview of an air quality monitor’s performance is to check the sensor installation guidelines and look at the monitor’s PCB and enclosure, as these can have a big impact on performance.
For example, PM sensors need to have both a clear intake and exhaust to monitor particles accurately. The intake and exhaust will typically be located close to one another, but it’s important that both of these are exposed to ambient air, as otherwise, particles can get stuck inside the enclosure and be recirculated back through the sensor again.
Another example is the temperature and relative humidity sensor, which can be greatly impacted by heat generated by other components and humidity trends within the enclosure itself. Ideally, this sensor should be placed far away from other components and have access to ambient air for the best measurements.
Each sensor manufacturer will have a set of guidelines for installing and using its sensors, and these guidelines are the best way to understand how a sensor should be placed and whether there are any particular enclosure guidelines that need to be followed for the best performance.
Check Qualitative Metrics
Finally, we can take a few qualitative steps to investigate how a monitor is likely to perform. Firstly, it’s important to look into the company to see if they employ scientists as off-the-shelf sensors often don’t perform well, and if scientists are working at a company on aspects like correction algorithms, this tends to indicate more interest in ensuring the devices are accurate.
Another important qualitative aspect to look into is partnerships and collaborations. Has the air quality monitor undergone any colocation projects with reference-grade sensors? Do reputable institutions like universities collaborate with the company? If yes, the monitors have likely not only been more extensively tested but are more reliable.
It’s also worth looking into the data accessibility of the monitor in question, as open and more thorough data is often more studied. For the sake of your own comparison, it’s also important to know how accessible the data is, as it can make comparisons much more difficult if the data is somehow locked down.
Accuracy vs Precision
Finally, before discussing how you can test the monitors and sensors yourself, we need to clarify the difference between accuracy and precision, as this will be important for understanding the rest of this article.
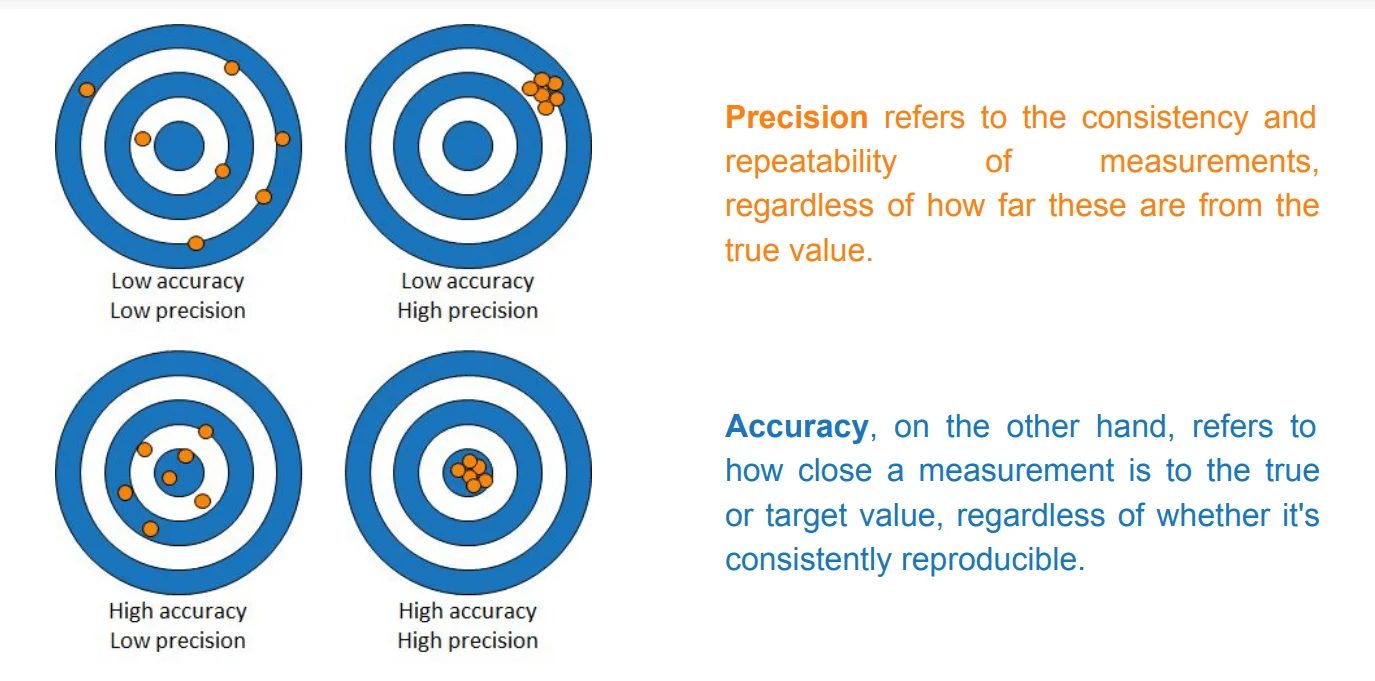
Accuracy refers to how close a measurement from an air quality monitor is to the true value of the given pollutant. An accurate sensor will provide readings that closely match ambient air quality. To test accuracy, a reference-grade monitor is typically needed.
With air quality sensors, accuracy is normally measured in absolute, relative or absolute and relative uncertainty. It’s also worth noting that sometimes accuracy changes depending on pollutant thresholds. Here are some examples you might find when looking at sensor specification sheets:
- 50 ppm - absolute
- ± 10% - relative
- ± 30 ppm ± 3% - relative + absolute
- ± 30 ppm / 3% - relative or absolute, whatever is larger.
Absolute uncertainty means that no matter what value the sensor reads, the true value should be within the given range. For example, if a carbon dioxide sensor has an absolute uncertainty of 50 ppm, whatever the sensor reads, the true value should be within 50 ppm of what is shown.
On the other hand, relative uncertainty is generally expressed as a percentage and this uncertainty changes depending the value recorded by the sensor. For example, with a 10% relative uncertainty, the same carbon dioxide monitor would read between 450 ppm and 550 ppm when the true concentration is 500 ppm. On the other hand, at a true concentration of 5000 ppm, it could read anywhere between 4500 ppm and 5500 ppm.
Finally, we have accuracies stated as either ± 30 ppm ± 3% or ±(30 ppm + 5% of reading) formats.
These calculations set an absolute uncertainty (the first number, in this case, 30) and a relative uncertainty that increases as the recorded concentration increases (in this case, 3%). At 1400ppm, we would expect a monitor with this stated accuracy to read between 1328 and 1472 ppm (30 ± 3% of 1400, which is 42, giving a total error of ± 72 ppm at 1400 ppm).
Of course, the lower the uncertainty the better. At lower concentrations, absolute uncertainty is usually more impactful, while at higher concentrations the relative uncertainty tends to make a much bigger difference.
Precision is different in that it indicates how consistently an air quality monitor (or monitors of the same type) can reproduce the same measurement under the same conditions. Even across multiple monitors, precise monitors (of the same kind) will yield similar readings for particulate matter concentration across multiple devices, assuming they are in the same location and exposed to the same conditions.
For example, three monitors could record PM2.5 concentrations of 18µg/m3, 19µg/m3 and 20µg/m3 simultaneously. These monitors are precise because they show similar readings, even if the true concentration is 50µg/m3. For this reason, we recommend trying to get your hands on at least three of the same monitors for reviewing so you can identify precision, as this is much easier to do than testing accuracy.
While precision is important, we ideally want monitors and sensors that are both accurate and precise. Conversely, if a monitor’s precision is poor, you can assume that its accuracy isn’t very good either.
Since every air quality monitor uses a different range of sensors - some just have particulate matter sensors, while others have a more comprehensive range - we will dive into the three main sensor types individually. Let’s begin with discussing how you can test the particle monitoring accuracy of your monitor.
PM Sensor Guidelines
The first sensor that you’ll want to look at is the PM sensor. Before diving into further details, it’s important to highlight one key point: The vast majority of low-cost sensors on the market only provide accurate readings for smaller particles such as PM2.5 and (in some cases) PM1.0. On the other hand, the PM10 readings from low-cost sensors often show poor to medium correlations with reference sensors.
What does this mean? Well, it leads to two key points.
Firstly, some readings, such as PM10 readings from low-cost sensors, are typically only useful for identifying trends, and the exact readings provided by consumer-grade air quality monitors typically have large errors.
Secondly, an air quality monitor uses the same sensor to provide all particulate matter (PM1.0 - PM10) readings. There are no separate sensors for each different classification of PM.
We can roughly split PM sensors into three categories, ranging from higher-quality and better-performing components to ones that don’t perform as well and are generally cheaper. While this list is far from exhaustive, it’s intended only as an example.
| Tier 3 (Low cost) | Tier 2 (Mid-range) | Tier 3 (Higher cost) |
|---|---|---|
| Cubic PM1006K | Plantower PMS5003* | Alphasense OPC-N3 |
| Winsen ZH03A | Sensirion SPS30 | |
| Sharp GP2Y10 | Cubic PM2009X |
Study the Literature
As mentioned above, the literature is the best place to start with any accuracy testing. While some of this can be quite daunting, there are fantastic (and far more digestible) reports from organisations such as AQMD and AIRLAB.
Without access to reference equipment, studies provide the best (typically) unbiased research into each sensor’s performance. While manufacturers of air quality monitors can change the parameters (such as correction algorithms) of the sensors used inside their monitors, we’ve found that most companies don’t edit the parameters of their sensors much, if at all. Furthermore, these studies, which delve into sensor technology, are still important for learning whether a sensor is accurate in the first place.
For example, at AirGradient, we apply the U.S. EPA correction algorithm, which has been tested and proven with PurpleAir sensors. This algorithm allows us to correct PM concentrations from the sensor’s raw values and provides far more accurate readings for smoke-based particles. Unfortunately, it’s often impossible to tell what algorithms manufacturers employ as they often don’t publish the information.
On top of this, some sensors are either new or uncommon and haven’t been discussed or tested in many studies. Also, let’s be honest - carrying out our own research is more fun and gives our reviews a unique approach. If you want to do your own accuracy testing, don’t despair! There are some ways you can test your monitor.
Precision
As we discussed above, precision is the ability of multiple sensors or monitors to identify the same trends and provide similar results. While this can be conducted under normal conditions, a better test is to manually create a variation in concentrations using a source of (somewhat) controlled pollutants.
For example, lighting a candle, match, or incense near the monitors should lead to an increase in the recorded PM concentrations across all monitors. Alternatively, you can try opening a window and watching how the monitors react. Again, we’re looking for an inter-device agreement. However, remember that many monitors take readings at set intervals (such as every minute). If there is a 20-second difference between the readings of the monitor, we would expect some variation in readings.
Accuracy
Moving on from precision, we can test for accuracy in a few ways, even without access to reference-grade equipment. To do this, we have two options - compare to a nearby reference station or a ‘known accurate’ consumer-grade monitor. Let’s address the first point.
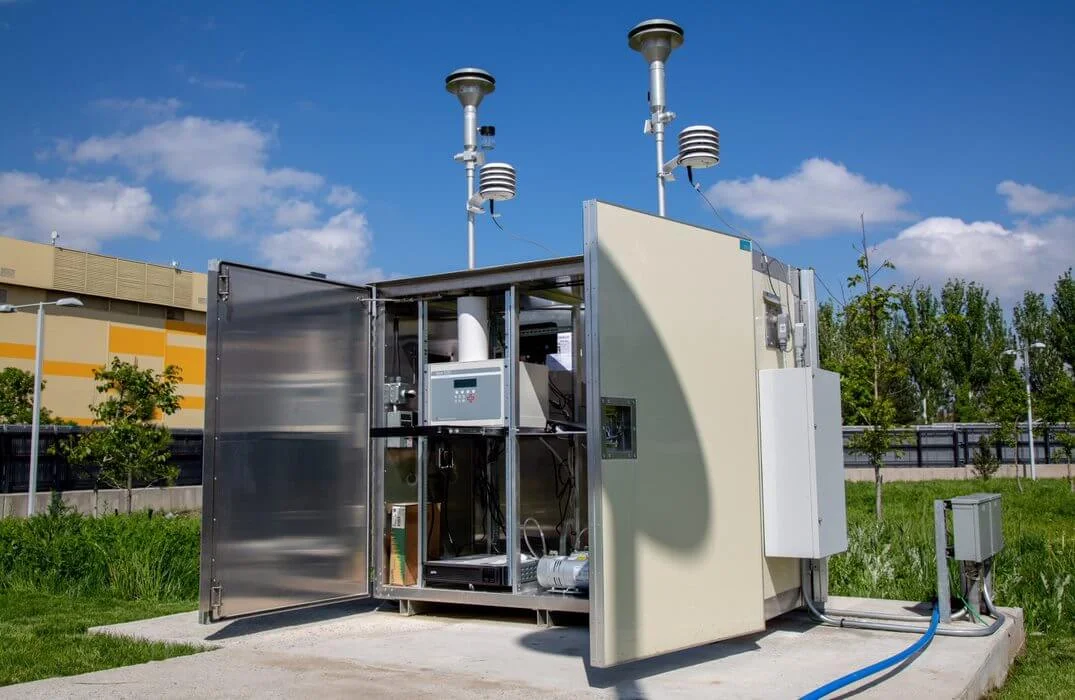
If you live in a large city or even in a smaller city in countries with good air quality monitor coverage, the chances are you have what we consider a ‘reference grade’ station relatively nearby. These air quality stations cost tens of thousands of dollars and are normally used by organisations and governments to monitor local air pollution. Typically, the data from these monitors can be accessed (downloaded) on a publicly available platform.
For example, when I lived in Bangkok and Seoul, I could view the local air quality department’s website to see information from monitors less than 1km from my home. While any comparison with the distance involved will be imperfect due to local emission sources such as traffic exhaust or a woodburner down the road, we can use even a somewhat distant reference-grade monitor to identify ‘background pollution’.
This is pollution homogeneously distributed over a larger area and doesn’t include the short-term peaks caused by local pollution sources. To make this process easier, many reference monitors will state whether they measure background pollution, traffic, or otherwise. If possible, try to find a monitor that states it measures background pollution.
To get the best results, try to place the monitor(s) you are testing as far as possible from emission sources (away from streets, barbecues, etc) and collect data, ignoring any short-term peaks. Once you have some data from the monitor you are testing and the reference monitor, you can compare the background pollution, discounting short-term peaks.
It’s important to note that most government and organisation stations use 24-hour sampling periods, meaning they are slow to adjust as the reported concentrations are averaged over the past 24 hours. Some personal air quality monitors will also allow you to view average data over set periods such as 24 hours. You will also want to ensure you are comparing the same unit (µg/m³) and not AQI.
While readings will vary, the closer you can place your monitor to a reference-grade monitor, the better. But we also understand this is often not possible. Unfortunately, it’s hard to determine with certainty the accuracy of a particulate sensor, but comparing background pollution levels is a good step in the right direction.
Another approach you can take is to compare the monitor to a ‘known accurate’ consumer-grade monitor. While no consumer-grade air pollution monitor is completely accurate, many now perform well due to improvements in microsensors and correction formulas. To identify which monitors have undergone testing, you can look into databases such as the AQMD AQ-SPEC and AIRLAB Microsensors database. Both of these organisations test consumer-grade monitors and provide comprehensive test results.
If the monitor you are testing is not already included in one of these databases, consider comparing it to one already covered, which performed well. Make sure to place the monitors next to each other and in the same conditions, and begin to collect data from them. The more data, the better!
Once you have data from both monitors, you can perform statistical analysis using Excel to create graphs such as time plots vs reference stations to see how they compare. However, it is important to note that sensors can be differently calibrated, so a difference in readings may not mean their performance is bad. In these cases, it’s important to look at the linear correlation of the monitors to identify if the differences are systematic and, therefore, calibratable or random. If you want to learn more about determining the accuracy of a sensor, please refer to this article and this article.
While the methods may seem complex, they are the best way to ensure, with some level of certainty, that the monitors we review are providing reliable data that we can trust. It’s important to remember that the purpose of these methods is to check the reliability of the air quality monitors, which is crucial for accurate air quality assessment.
Carbon Dioxide Sensor Testing
First Steps
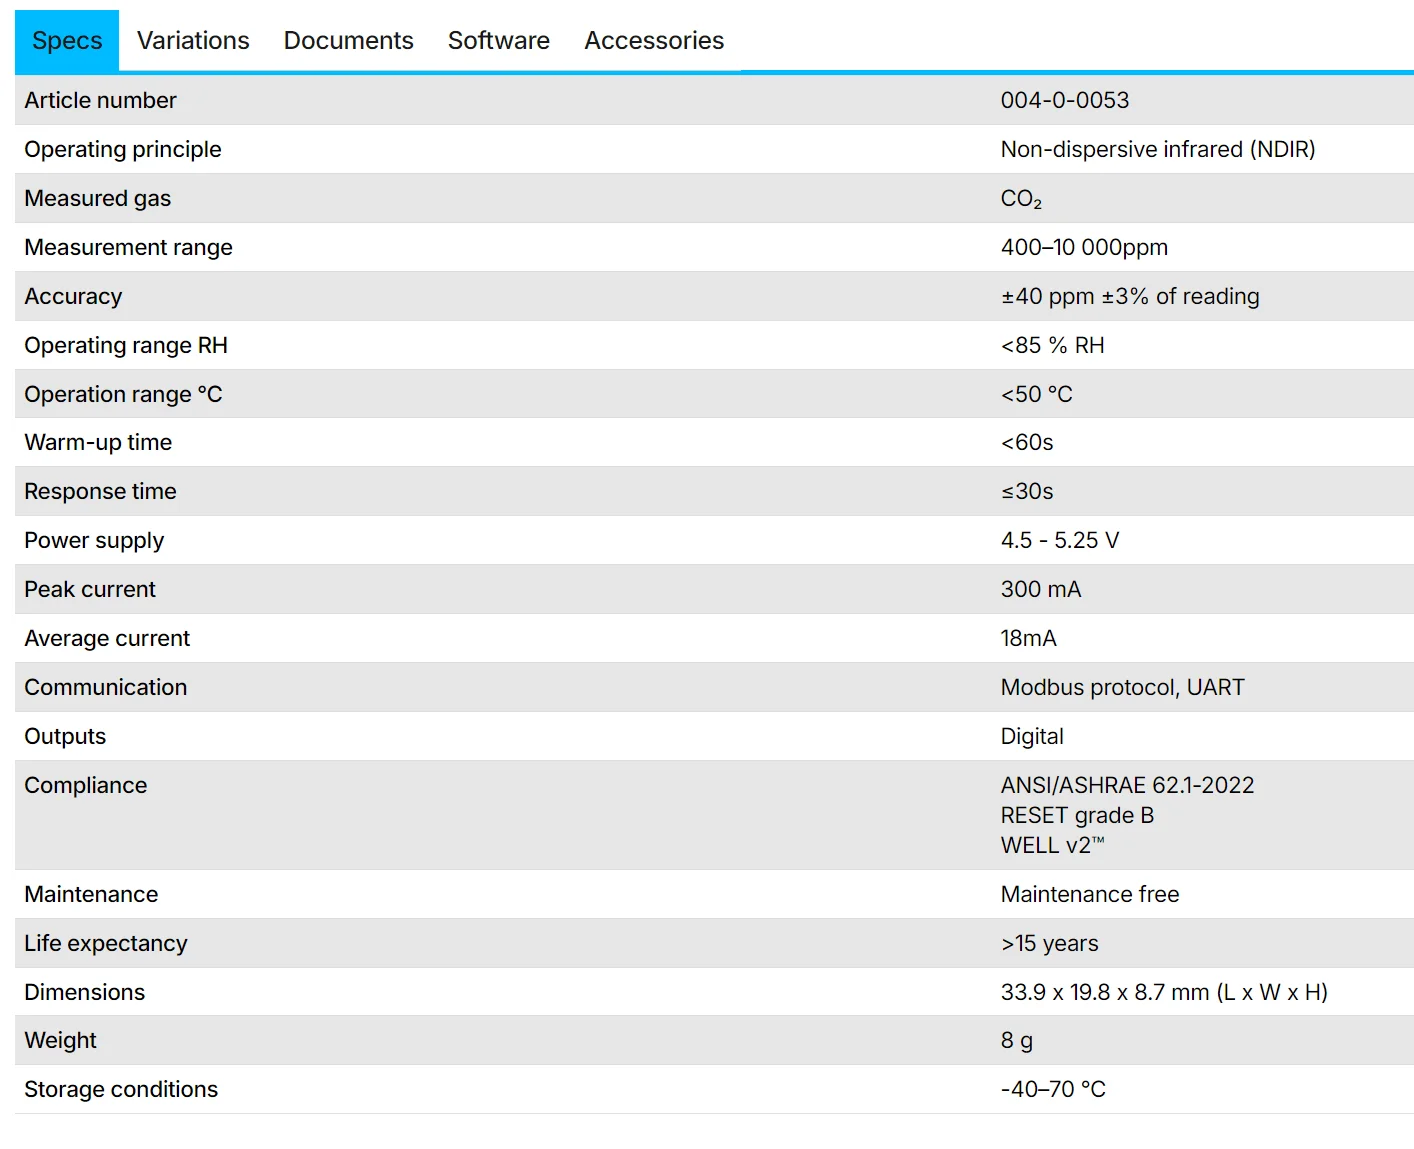
While particle sensors are difficult to test accurately without reference equipment, carbon dioxide sensors are a little easier. A high-quality consumer-grade sensor that is calibrated correctly provides similar readings (Most CO2 monitors have a stated accuracy of ± 10% of the reading or less) to reference-grade equipment. This means that, provided you are comparing to a trusted consumer-grade sensor, you can much more easily accurately test a CO2 sensor than a PM sensor. Below is a non-exhaustive list of some common carbon dioxide sensors and how we would rate them based on general performance and features.
Also, please note that some of these sensors mention ‘eCO2’. This means that the sensor is actually estimating CO2 derived from VOCs, and these sensors are significantly less accurate.
| Tier 3 (Low cost) | Tier 2 (Mid-range) | Tier 1 (Higher cost) |
|---|---|---|
| Most non-NDIR sensors | Sensirion SCD4x | SenseAir S8/S88 |
| Sensirion SGP30 with eCO2 reading | Cubic CM1106H-NS | SenseAir Sunrise |
| CCS811 with eCO2 | Winsen mh-z19x | Sensirion SCD30 |
We want to follow the same steps we did for the particle sensors. Firstly, it’s important to confirm which sensor is inside the product by asking the manufacturer, researching online, or, in some cases, opening the monitor and looking for a brand name and model number. Knowing this information is important because there are different types of CO2 sensors. Consumer-grade CO2 monitors can either be based on optical principles (transmissive or photoacoustic nondispersive infrared (NDIR spectroscopy) or on methods involving electric current such as MOS (Metal Oxide Semiconductor) sensors or electrochemical sensors. Optical methods (like NDIR) are usually very accurate and, therefore, also used in reference monitoring equipment. MOS and electrochemical sensors tend to be less accurate, require frequent manual calibration, and have shorter lifespans.
It’s important to note that before you test any carbon dioxide monitors or sensors, you must ensure they are all calibrated correctly. Carbon dioxide sensors are prone to drift, even over relatively short periods, and other sensors feature ‘auto calibration’ cycles, which can quickly cause them to read differently. Therefore, ensure you calibrate all the monitors involved in your testing before running any tests.
To do this, take your monitor outside or place it near an open window or door in a room with no one present. Then, trigger the device’s calibration (usually done via an app or web dashboard) and leave the device alone in the open air until it has finished calibrating. This process will often take 5-10 minutes. If testing multiple monitors, it’s best to calibrate them at the same time and in the same setting.
NDIR or Not?
Since NDIR sensors are generally the best consumer-grade carbon dioxide sensors, it’s vital first to ensure the sensor in your monitor is indeed NDIR. While the best way to do this is to find out the sensor’s model number and manufacturer, you can also run some simple experiments to see if the monitor uses NDIR or another form of sensor like a metal oxide sensor.
The issue with metal oxide sensors is that they don’t directly measure carbon dioxide, and just estimate a concentration based on other gases. This, of course, can lead to inaccurate readings as the sensor isn’t directly measuring carbon dioxide. To know if you have an MOX (or other inaccurate CO2 sensor) find something high in VOCs like hairspray, acetone, alcohol, or nail polish - even an uncapped marker pen should work!
Now, find a sealable (and as airtight as possible) container and place the monitor and the VOC source inside. Just uncapping the nail polish, acetone, alcohol, or marker pen should be enough to trigger a reaction. If the sensor is NDIR, you shouldn’t see any difference in carbon dioxide concentration due to the VOC source, but if the monitor uses a metal oxide sensor, you will quickly begin to see discrepancies in the readings. If the monitor also has a VOC sensor, you should be able to see this climb while the CO2 sensor continues to provide consistent readings.
Precision
Again, if possible, it’s best to test two or three monitors with the same sensors to get an understanding of precision. This will allow you to test the precision (inter-device similarities) of the CO2 sensors in the monitor and establish whether they have similar findings. If the device readings don’t correlate well, the accuracy of the sensors is likely to be poor, too. Again, remember to ensure the sensors are calibrated before performing this comparison.
One good way to test the precision of carbon dioxide sensors is to leave the monitors you are testing in an unventilated bedroom overnight while you sleep. You should see the concentration spike during the night, which will likely be high. This will allow you to see if the inter-device precision drops at higher concentrations or remains consistent throughout.
Due to the relative uncertainty of CO2 sensors, the precision should remain similar, but accuracy will decrease at higher concentrations. For example, at 1000 ppm, we would expect to see all tested monitors with a stated accuracy of ± 30 ± 3% showing results between 940 ppm and 1060 ppm. However, at 10,000 ppm, we would expect to see results between 9670 ppm and 10,330 ppm.
Past this, or if you can’t compare the readings between multiple monitors, it’s worth researching online. Suppose the sensor comes from a major manufacturer such as Senseair, Sensirion, or Cubic. In that case, you will likely be able to find tens of studies comparing the accuracy of the monitors to reference-grade equipment and other sensors.
Accuracy
Another option is to use a known-accurate (for consumer-grade products) sensor as a baseline. Any sensor with a stated accuracy of 30 ppm ± 3% of reading should prove adequate for this task, and sensors like the Senseair S8, Senseair Sunrise and Sunset, and Sensirion SCD30 are accurate enough to be used for comparing other sensors. You can then apply the same statistical methods for the comparison as described for the PM sensors.
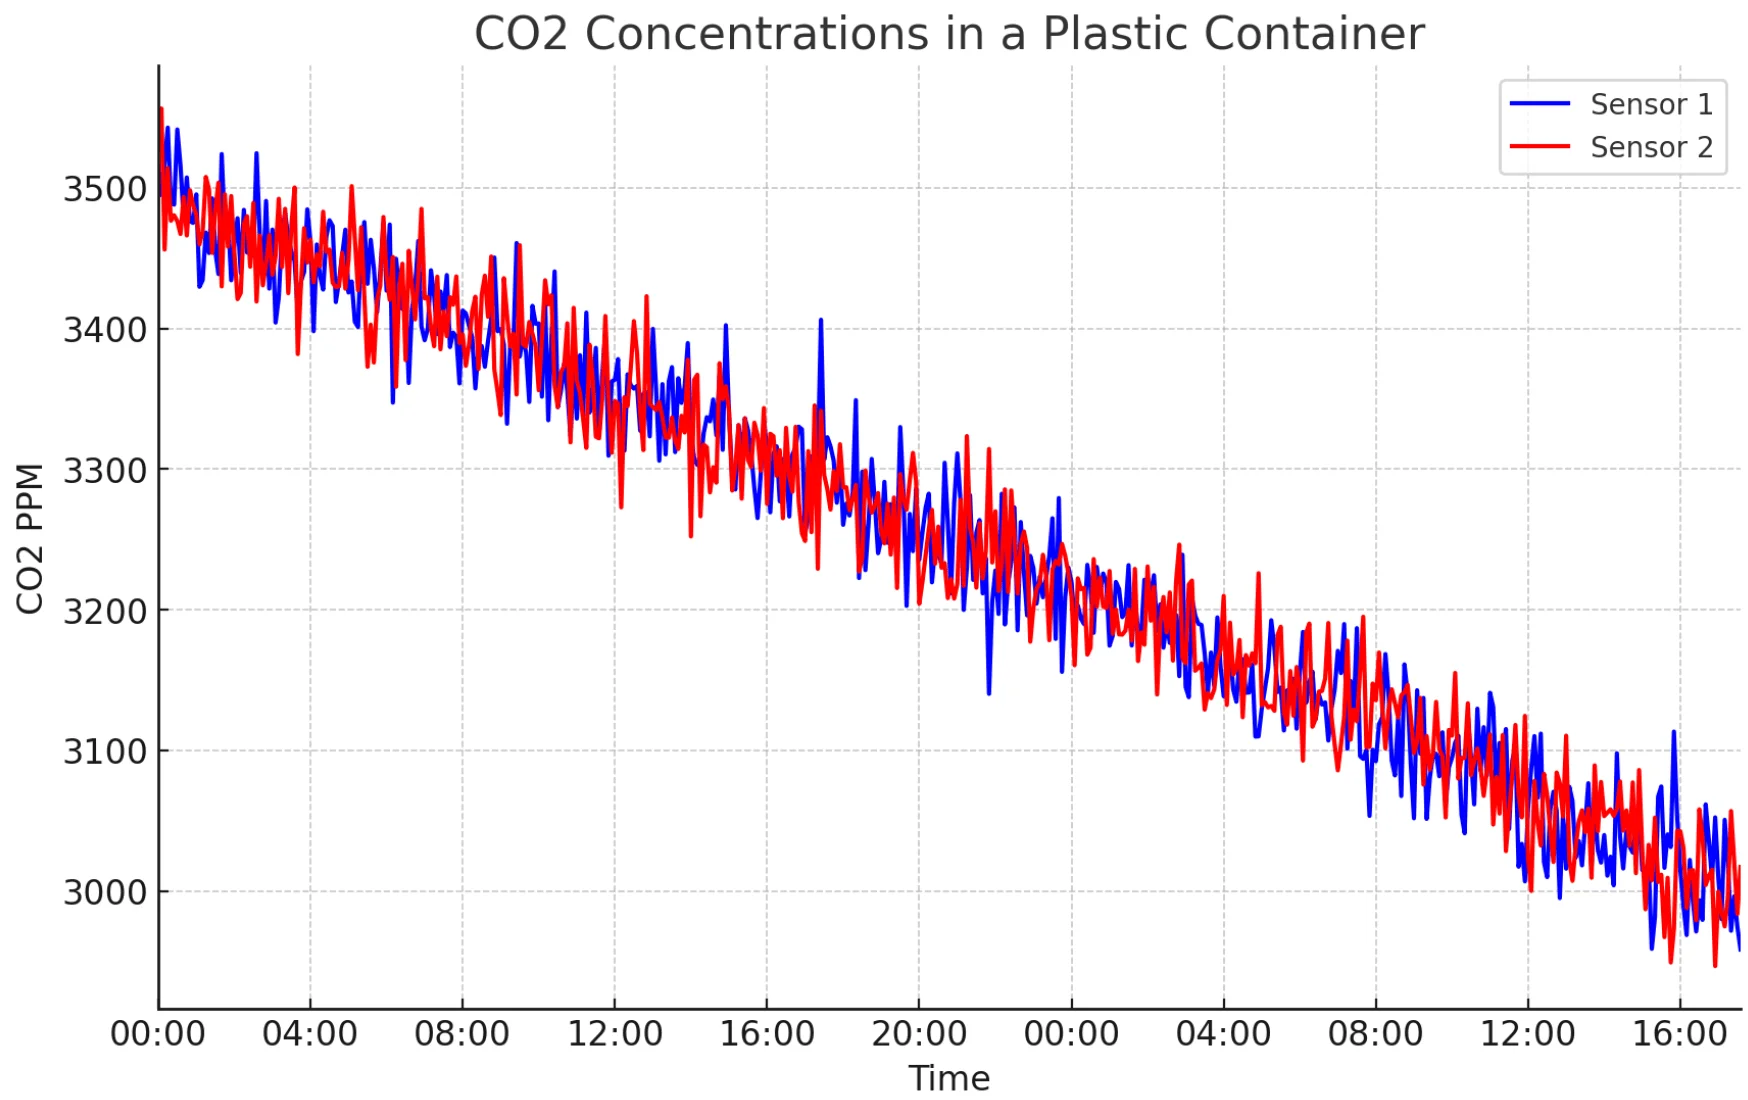
If you don’t have a known-accurate sensor, or if you’re curious about the performance of one of these sensors, another experiment you can try is to put the monitor(s) in an airtight container with a set CO2 concentration. Getting an exact concentration is impossible without reference gas, but you can exhale into the container to achieve a similar effect. Ideally, you’ll want to get the container to a concentration around 2000-3000ppm and then leave it sealed with the monitors inside.
This is an interesting way to test accuracy because, in theory, the CO2 concentration in the container should stay consistent until it is opened. Of course, the concentration will slowly decrease if there is even a very minor leak. Either way, since we know the concentration should remain constant or very close to it, we can see how much the sensor’s recordings deviate from that value throughout the experiment. I’ve run this experiment many times, and while some monitors will always be within 50 ppm of the expected concentration, some can deviate by 150 ppm or more.
If you want to go deeper, you can expose your airtight container with the CO2 monitor inside to different conditions (e.g. change the temperature). Theoretically, the monitor should continue providing consistent (or near-consistent) readings if the manufacturer has accounted for these changes in conditions. However, some sensors are prone to temperature changes, so you might see differences in how the sensor performs under different conditions, which is an important consideration for accuracy.
VOC Sensor Testing
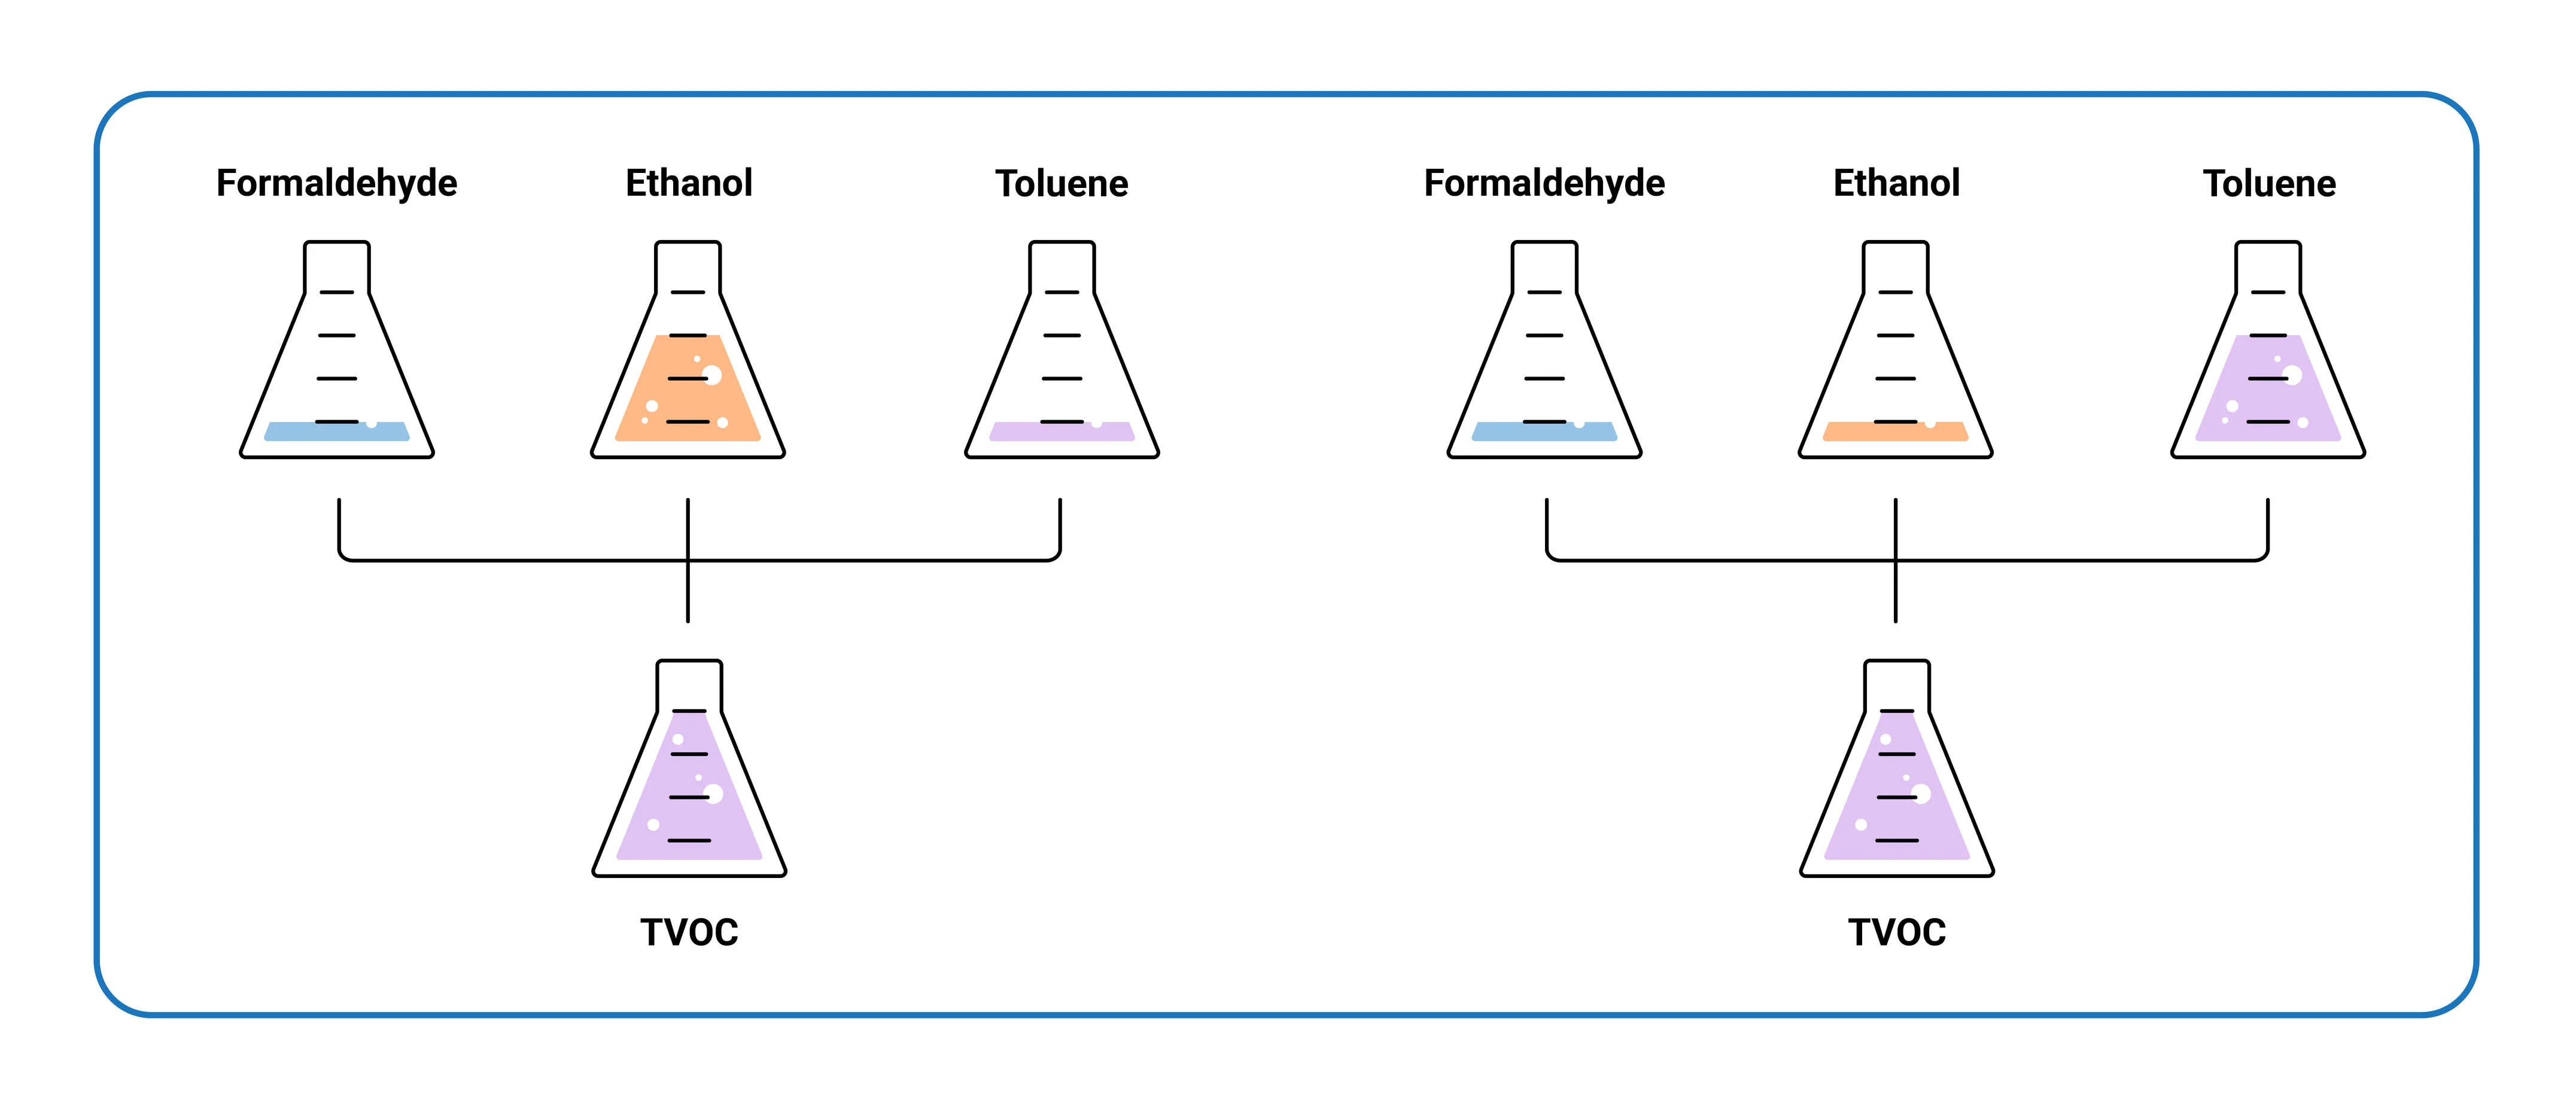
Volatile organic compound (VOC) sensors provide unique challenges as they are prone to error and are far less accurate than particle and carbon dioxide sensors. This is mostly because there are many types of VOCs, and each sensor has different sensitivities to certain gases. In other words, a VOC sensor may be more sensitive to ethanol than formaldehyde, but the latter is far more dangerous. This makes VOCs the most difficult parameter to measure in low-cost monitors, and it also makes it difficult to classify individual VOC sensors as good or bad.
On top of this, VOC sensors such as the Bosch BME688 and Sensirion SGP4X series (used in AirGradient monitors) show VOC values as an index by default and not as an absolute value (in parts per billion). This choice was made due to the issues mentioned above with absolute readings. The index features a quickly updating baseline. This means that any amount of VOCs in the room will be used as a reference (100%), and the sensor only detects changes in this amount.
In other words, the sensors that use these indexes are only useful for identifying trends in VOCs, such as increasing or decreasing levels, instead of absolute values. Even if an air quality monitor shows absolute values, it’s important to note that they shouldn’t be relied on due to the sensitivities of sensors to different VOCs (and the fact that we never know the exact composition of VOCs in our air).
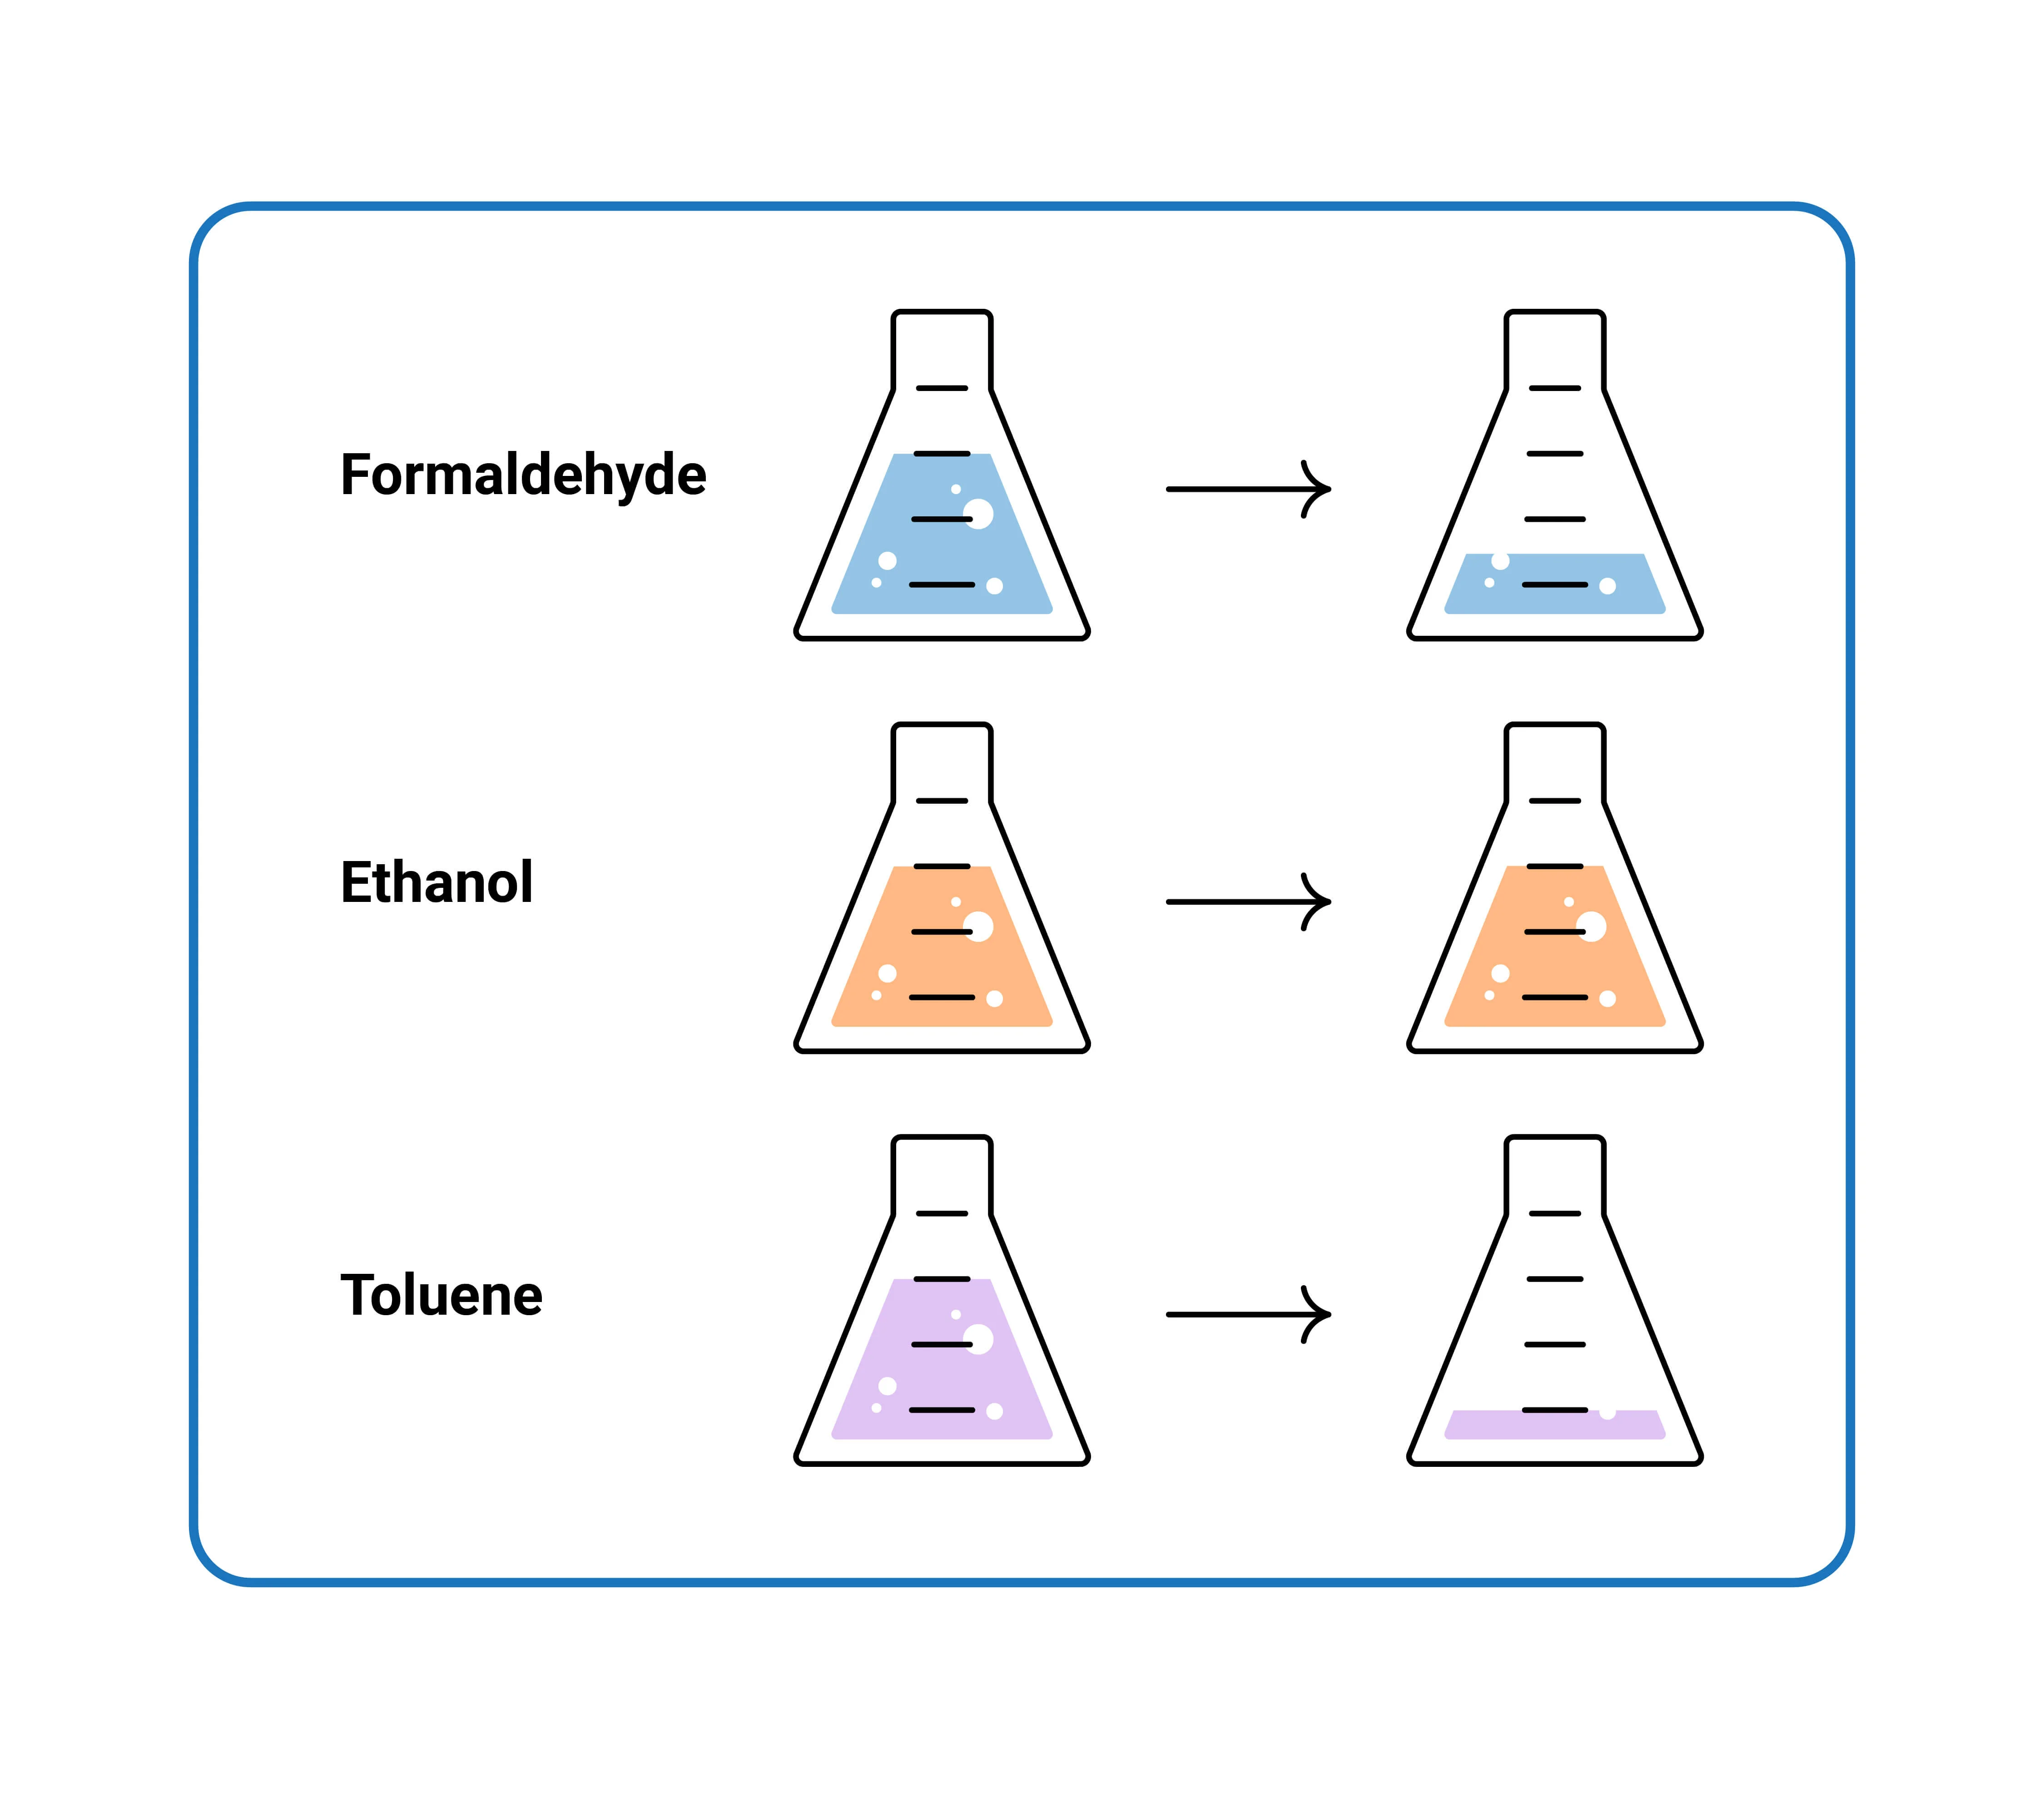
Image based on Sensirion’s ‘Compliance of Sensirion’s VOC Sensors with Building
Standards’
Luckily, even with these caveats, there are some ways that you can test the performance of VOC sensors and ensure they respond in the way they should. As with the other sensors we’ve listed, you will first want to find the exact VOC sensor model so you can determine if the sensor is using an index (often shown as 0-100 or 0-500 with 100 as the baseline) or an absolute value (shown in ppb). From this information, you can also check manufacturer specifications to see the stated accuracy and sensitivity to different volatile organic compounds.
Sensor Type
Three main types of VOC sensors are used in consumer-grade monitors, and below is a brief introduction to each, alongside their strengths and weaknesses. PID sensors are not common in consumer-grade monitors, but recently, a few have featured them.
While knowing the differences between these sensors won’t tell you their accuracy, it will let you know their biggest strengths and weaknesses.
Metal Oxide Semiconductor (MOS) Sensors
- Principle: Measures changes in electrical resistance when VOCs interact with the metal oxide surface.
- Examples: Sensors from manufacturers like Figaro or AMS (CCS811).
- Accuracy: Generally good for detecting the presence of VOCs but can be influenced by humidity and temperature. Typically less accurate in quantifying specific VOC concentrations.
- This fantastic document has more details.
Photoionisation Detectors (PID)
- Principle: Uses ultraviolet (UV) light to ionise VOC molecules and measures the resulting electrical current.
- Examples: More commonly found in industrial applications, but some high-end consumer devices may use simplified versions.
- Accuracy: High sensitivity and capable of detecting low levels of VOCs, but can be expensive and require frequent calibration.
Electrochemical Sensors
- Principle: Measures the electrical change resulting from a chemical reaction between VOCs and an electrolyte in the sensor.
- Examples: Commonly used in specific gas detection (e.g., formaldehyde sensors).
- Accuracy: Good for specific gases but may not be suitable for a broad range of VOCs.
Infrared (IR) Sensors
- Principle: Measures the absorption of infrared light by VOC molecules.
- Examples: Typically used in more specialised or industrial settings.
- Accuracy: High accuracy for specific VOCs but less common in consumer-grade monitors due to cost and complexity.
Precision
Once again, try to get hold of three air quality monitors or three of the same sensors so you can compare their precision. Whether using an index or an absolute value, we should expect relatively similar inter-device readings between the three. Of course, if they use an index, you must also ensure that the monitors have been exposed to the same conditions for at least a day before the test (otherwise, the baselines can differ since these sensors often update their baseline every 24 hours).
Once you have your monitors on hand, you can try a range of tests to see how they react. A good way to do this is to place the monitors in a sealed container and expose them to various VOC-emitting sources. Some good examples are nail polish, an uncapped marker pen, and acetone. We should see similar results across all monitors if the devices are precise.
If the monitors record significantly different results, it’s worth ensuring they are calibrated correctly. Suppose the devices have a manual calibration option. In that case, this will allow you to force a new baseline, and the monitors should read similarly after having new baselines recorded in the same conditions. If the monitors continue to react to VOC sources differently, they are likely not precise.
Accuracy
While VOC sensors are inherently not very accurate (unless you know the exact composition of VOCs being measured, which is never the case unless you have very large and specific measurement equipment), there are some interesting experiments we can do to at least see if they react in the way we expect.
For one of these experiments, you will want to have some different liquid VOC sources like alcohol, acetone or paint thinner. Measure out specific amounts (start small) and then dilute these with water. Now, place the sensor(s) in a stable, enclosed container (to minimise external influences) and introduce the VOC source at a distance from the sensor. Mark this distance as you will want to keep it consistent for upcoming tests.
Record the readings to see how they react to this diluted VOC source being introduced. After the readings have settled down and remain somewhat consistent, you can change the concentration of the VOC source (ensuring it’s placed the same distance from the monitor every time and, ideally, at a relatively stable temperature) and repeat the experiment. If you double the concentration of the VOC source, we would expect the monitor to record roughly double the concentration, too - the same goes for every other concentration change you make.
When running this experiment, try to switch to absolute readings such as ppb (parts per billion) if possible. If the sensor only has an index function, you will see an increase in VOC concentration as you double the concentration of the VOC source, but it won’t double as it would in absolute readings.
You can repeat this experiment with different VOC sources to see exactly how the air quality monitor reacts to different sources and, therefore, different VOC compositions. While this experiment is very rough, it’s fascinating to see how the monitors react and provide some insight into how they perform.
It will also tell you other characteristics of the sensor, such as its response time and, in some cases, even what it is more susceptible to. That said, you can generally also find this information in the sensor’s spec sheet, including what it is more and less susceptible to.
Conclusion
We’re pleased to see that air quality monitors are becoming more widely discussed as awareness about air quality grows. Whether you’re a reviewer, a concerned user, or someone considering a new purchase, we want to offer a set of guidelines that can help you better assess the performance of consumer-grade air quality monitors.
While imperfect, these guidelines are designed to give you and anyone else a deeper insight into how an air quality monitor functions and the technology it relies on. By following these steps, you’ll be better equipped to understand your monitor’s capabilities and make more informed decisions.
We recognise that this information might initially seem overwhelming, but we’re here to help. If you have any questions or need further clarification on how to test your air quality monitor, please don’t hesitate to reach out to us. We’re always happy to assist.