AirGradient Open Source Air Quality Monitors
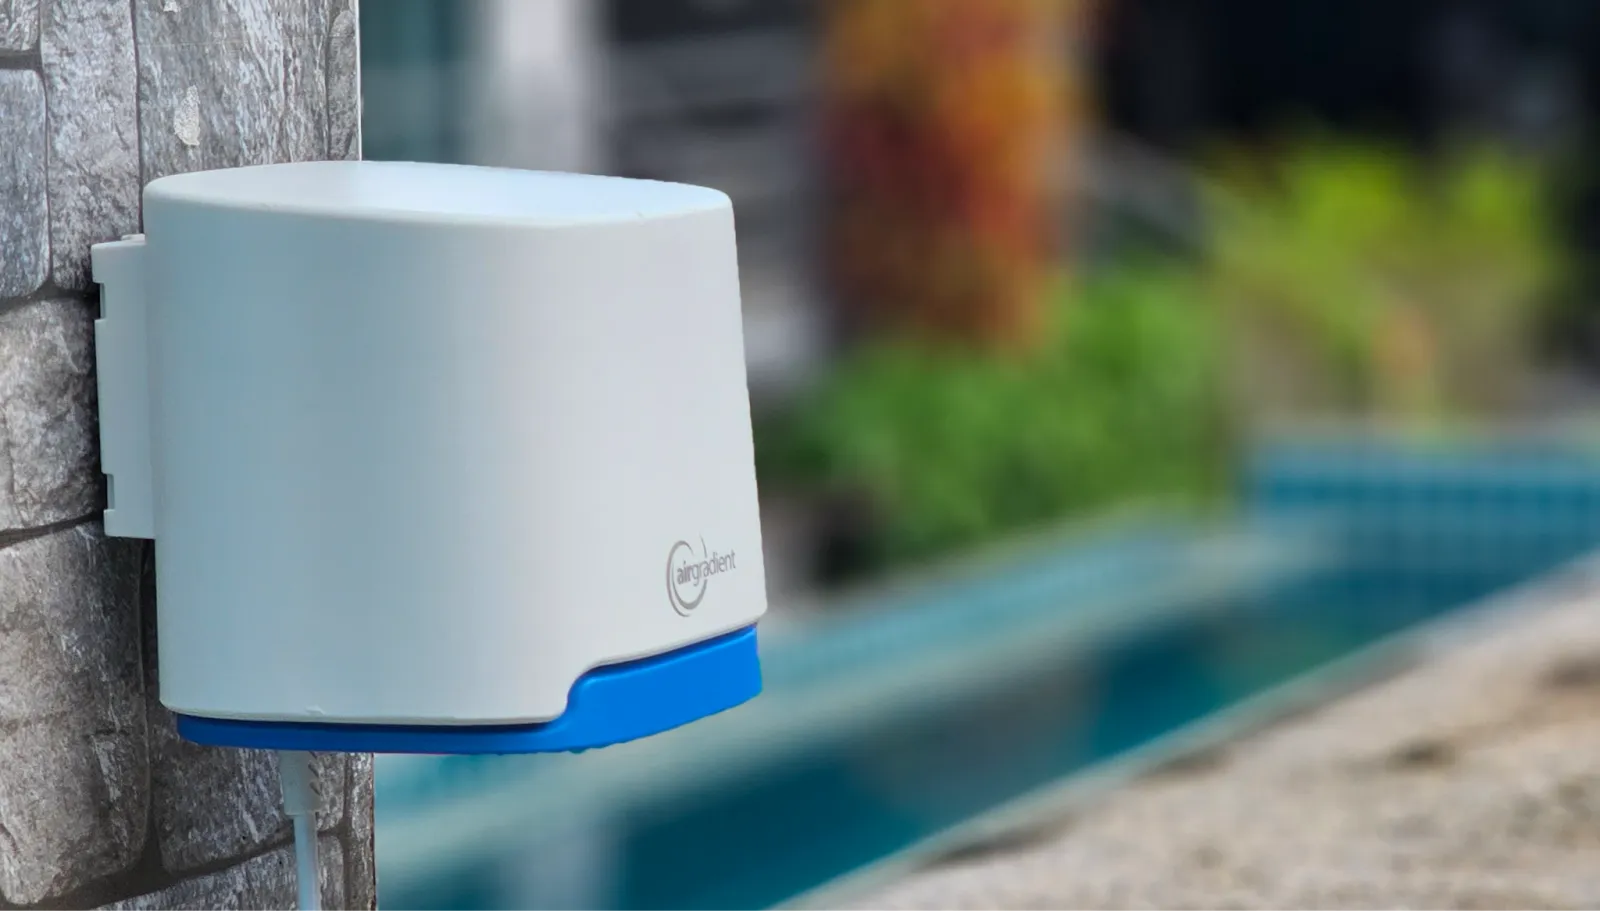
We design professional, accurate and long-lasting air quality monitors that are open-source and open-hardware so that you have full control on how you want to use the monitor.
Learn Moreby Achim Haug and Ethan Brooke on June 28, 2024
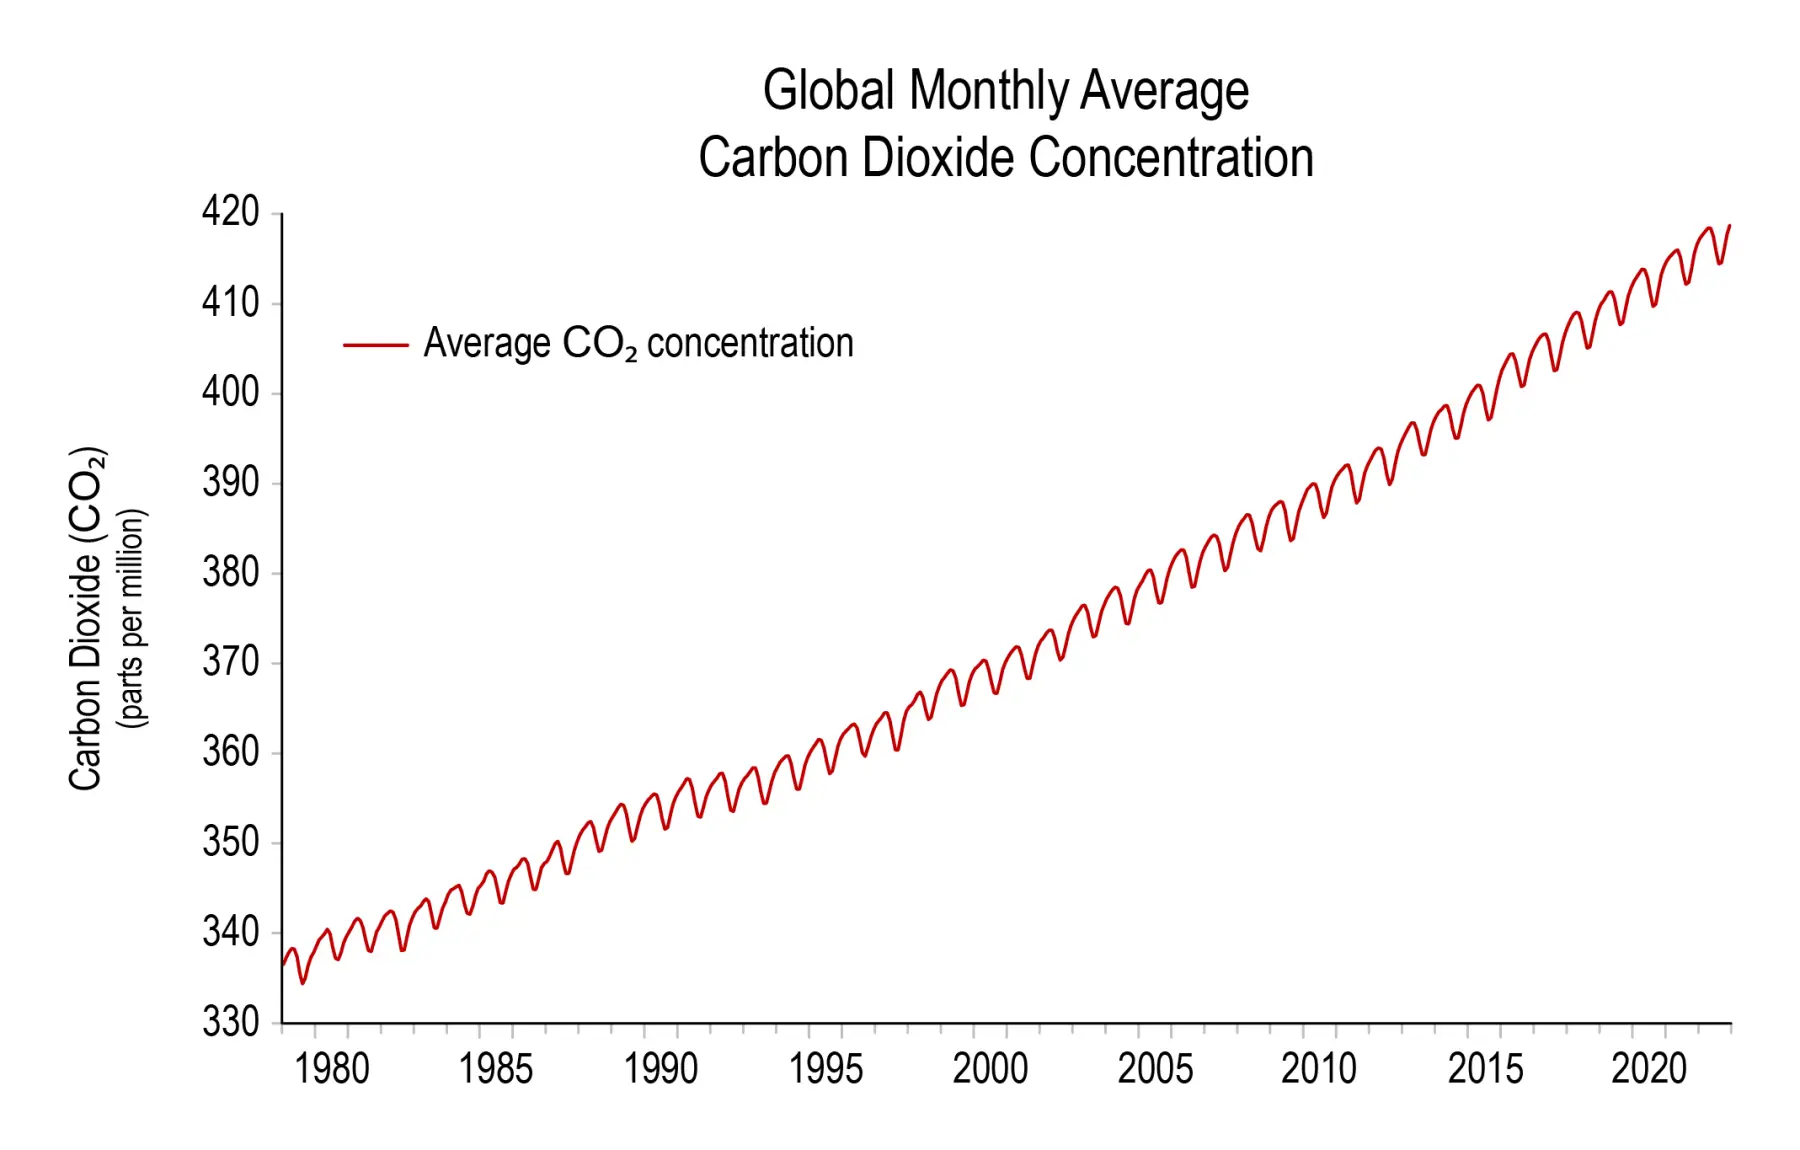
We have just launched the first large real-time global crowd-sourced carbon dioxide map. The data comes from more than 500 open source AirGradient air quality monitors that are run by engaged citizens around the world. This marks a significant milestone in environmental monitoring, especially in the context of ever-increasing CO2 levels, which we recently saw increase by a record-breaking 5ppm compared to last year.
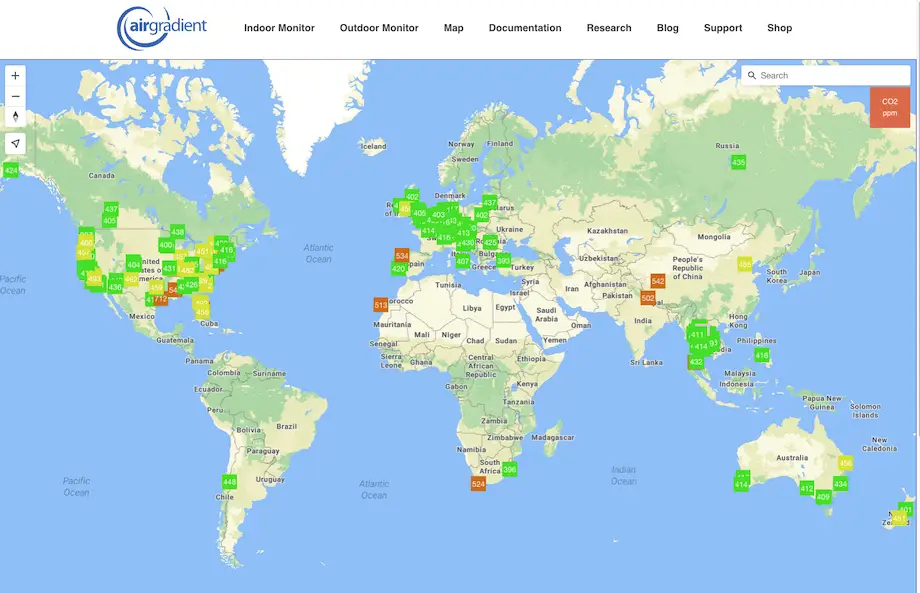
To try the map, go to the below web page, and then switch to CO2 with the orange button on the top right.
https://www.airgradient.com/map/?zoom=1&lat=49.2125578&long=16.62662018&org=ag
In order to reduce our carbon emissions, we have to identify and reduce local emissions. Sometimes this is easy, e.g. when it’s a large, centralized contributor like a power plant. However, there are also significant contributions that are much more difficult to detect and control.
To detect these local emission sources, we do not need very expensive reference grade monitors, because we don’t need to get a perfect absolute ppm value. What we need is to see the relative changes over time and relative comparisons to other monitors.
Here are some examples:
The much lower price and size of these sensors allow a much denser installation of sensor networks and with cloud based algorithms and additional parameters like wind speed and wind direction powerful mapping of regional CO2 emissions will be possible.
To demonstrate that this is not just a theory, we want to demonstrate the usefulness with some examples in Bangkok. Below is all derived from data that is already publicly available on the AirGradient map.
One of our monitors is located right on the Nana pier (many thanks to the citizen who placed it there!).
Bangkok has a number of canals (called Klongs) which are an effective way to avoid the prominent traffic jams in the city. If you visit Bangkok, it’s a lot of fun riding them. These boats are used primarily by commuters on their way to the office (and back) and thus operate from around 6am to 8pm with peak traffic during rush hours.
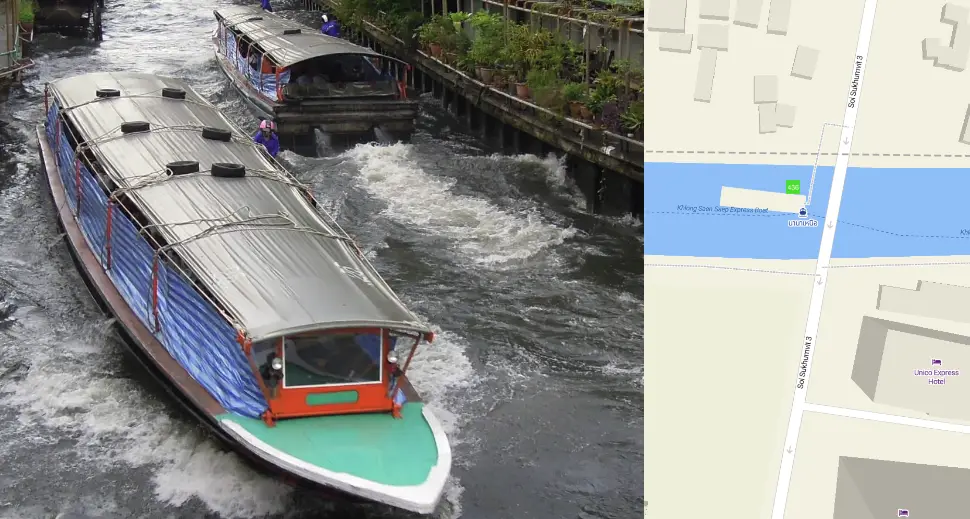
However, the speed boats operating these Klongs are famous for their pollution. So with the monitor right at the pier, let’s look at the PM2.5 and CO2 data:
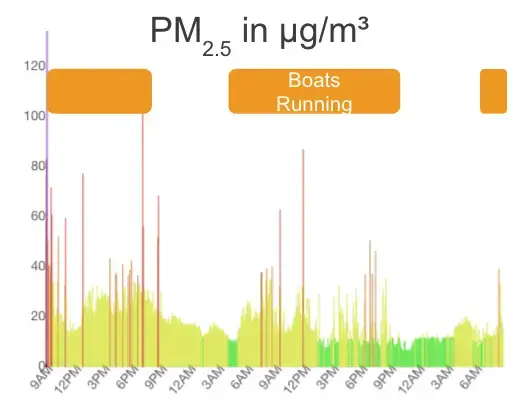
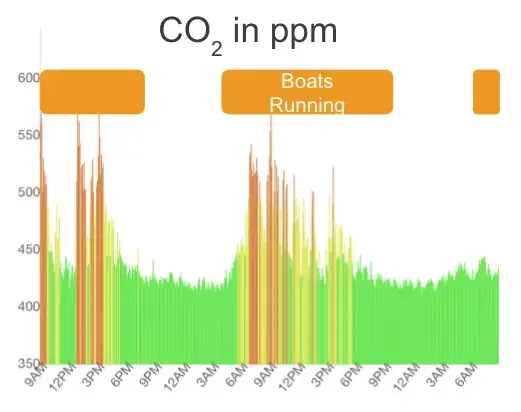
What we can see is spikes in both PM2.5 and CO2 throughout the day that match the operating hours of the boats. Furthermore, we can clearly see more spikes during the rush hours in the mornings and late afternoons.
Now, let’s compare this with an area of Bangkok with less traffic.
Across the Chao Praya river, there is a relative quiet neighbourhood where we have another AirGradient monitor operating (also many thanks to the contributor!).
The street is so small that actually no car can enter. Only traffic by foot, bike or motorcycles.
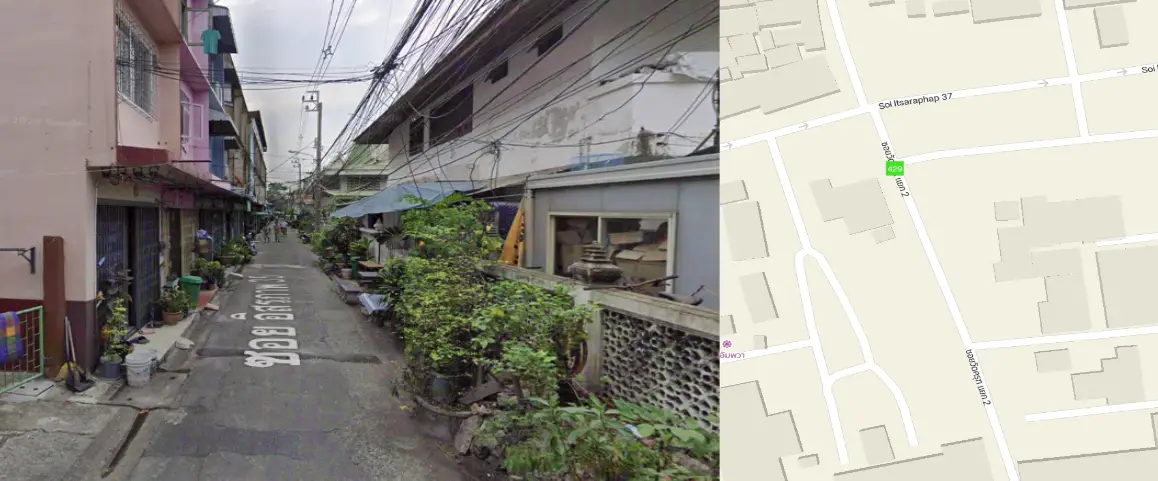
Now let’s look at the data from that small street.
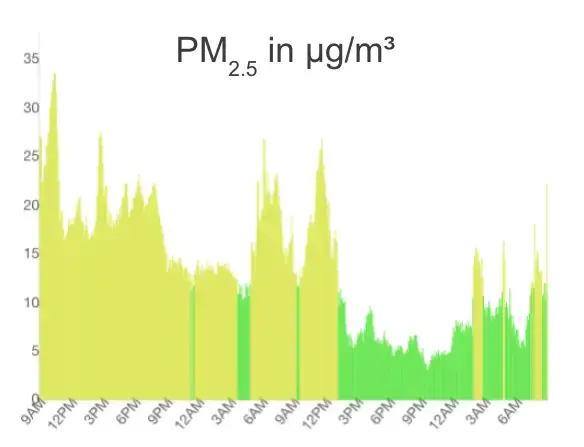
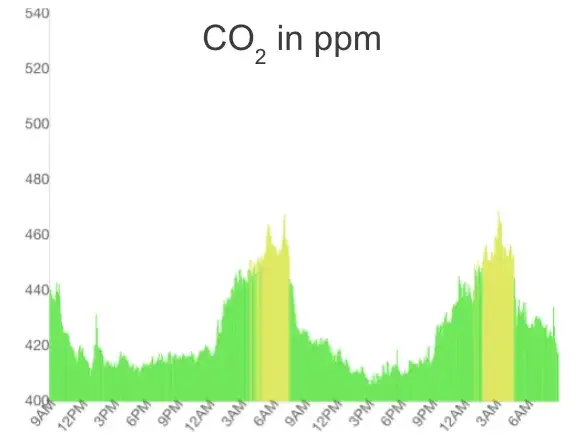
We see a much smoother pattern for both PM2.5 and CO2 without major spikes. This pretty much matches the photo from that location.
We can clearly see the emission events from the boats on the canal. As a next step, this data can be quantified and average pollution levels calculated. When this baseline has been created, mitigation measures can be implemented. For example there is an initiative in Bangkok to switch to electric boats. Once this happens, the spikes should disappear, and we should clearly see the positive effects of the reduced emissions.
Now imagine we can cover the city with many more local monitors. This would create a powerful tool to identify many local emission sources and then working on reducing their impacts. As a result people in Bangkok will breathe healthier air and the city would have a reduced carbon footprint.
In our monitor we use the SenseAir S8 NDIR CO2 sensor. We have tested a number of sensors from different manufacturers and found the SenseAir sensor modules to perform best. This is the default sensor we use in all our open-source monitors.
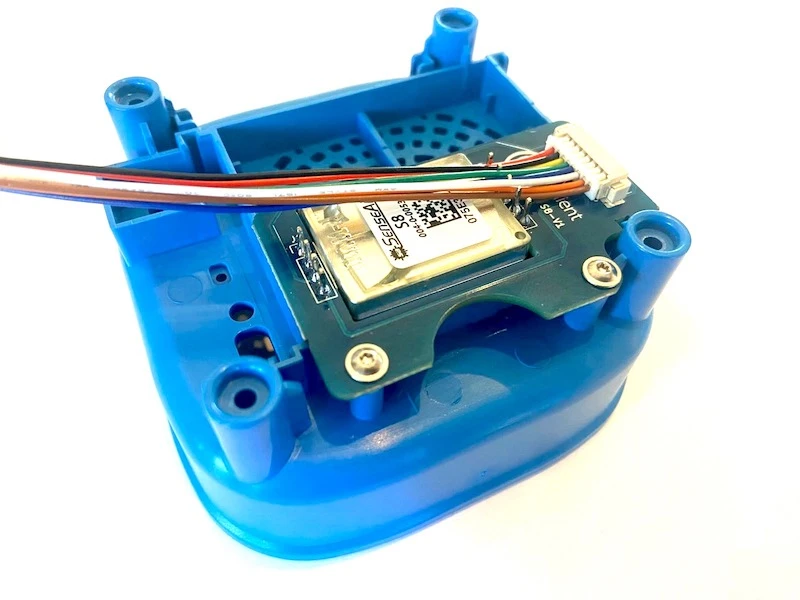
We have extensively tested the performance of this low-cost module against scientific reference instruments at the University of Cambridge.
While low-cost monitors are not reference-grade, the research has shown that they have a high correlation with reference stations and thus are well-suited in identifying emission sources and events.
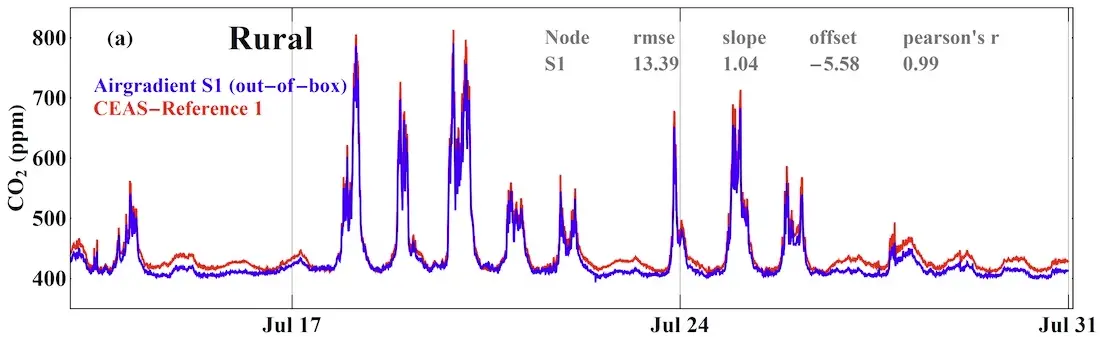
You can read more about this research in our blog post Low Cost CO2 Sensors Performance Outdoors Close to Reference Grade Instruments.
Local emission sources like above are among the most significant contributors to atmospheric carbon dioxide levels. Factories, power plants, traffic, construction, agricultural activities, boats in Bangkok, and wildfires can significantly increase atmospheric carbon dioxide. As described above, a denser network of local low-cost CO2 monitors can play a critical role in identifying these pollution sources and understanding their impact.
To identify these local emission sources, expensive reference-grade instruments aren’t needed. Rather a dense network with low-cost monitors can provide a detailed map of these hot spots in a city. If a combined global effort is done, we will hopefully be able to reduce our total carbon emissions and slow down climate change.
Our existing global network with more than 500 monitors is already significant, but there are still many areas where we do not have enough data. We invite all interested and concerned citizens to help us collect more data. All data you share with us is open and a great data source for scientists to build upon.
Using the power of community involvement, our already established air quality monitoring network, and our open-source, open-data approach, we aim to provide a comprehensive and detailed understanding of CO2 concentrations across various regions. To allow everyone to participate, we’ve made our monitors affordable and easily accessible. By contributing to this global effort, citizens can play a vital role in identifying emission hotspots and understanding the local impact of CO2 emissions.
You can either use our open-source build instructions and build the monitor completely on your own, or purchase it as a kit or as a fully assembled unit directly from us.
The CO2 map is in its very early stages. Over the next weeks and months many more features will be implemented. We have a lot of features in mind but would really like to invite others to participate.
If you are an organisation, researcher, policymaker, or otherwise interested in our data, please contact us. Our open-source and open-data approach supports collaborative efforts and provides valuable insights that can drive informed decision-making and effective climate action. If you want to utilise this data for research or policy development, please contact us for access and further collaboration opportunities.
We are excited to see how the network can be used in the future, and we see not only research and policy-making opportunities but also an educational potential for communities and schools, raising awareness about CO2 emissions and climate change by engaging citizen scientists. We are also excited about the scientific collaborations that we hope can become possible due to this extensive network.
Curious about upcoming webinars, company updates, and the latest air quality trends? Sign up for our weekly newsletter and get the inside scoop delivered straight to your inbox.
Join our Newsletter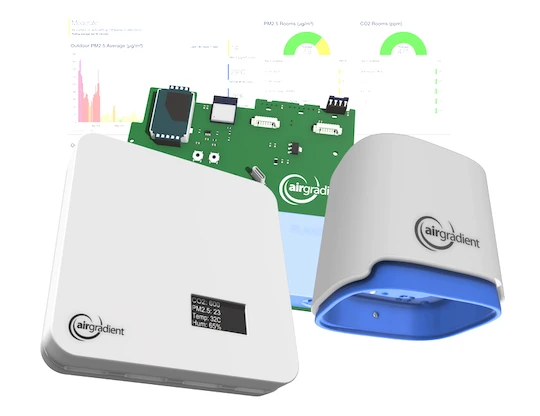
We design professional, accurate and long-lasting air quality monitors that are open-source and open-hardware so that you have full control on how you want to use the monitor.
Learn More